
Figure 6.
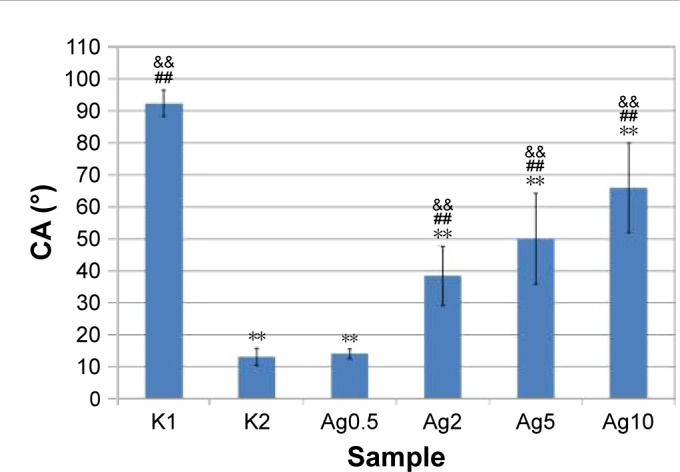
Surface wettability of the titanium disks expressed as contact angle (CA) values (Θ).
Notes: All the data were expressed as mean ± standard deviation (n=15). The vertical bars indicate standard deviation. ANOVA showed statistical differences between the samples (P=0.000). **P=0.000 compared with K1; ##P=0.000 compared with K2, &&P=0.000 compared with Ag0.5 (Tukey’s HSD). The incorporation of nanosilver resulted in a decrease in the surface wettability.
Abbreviations: ANOVA, analysis of variance; HSD, honest significant difference.