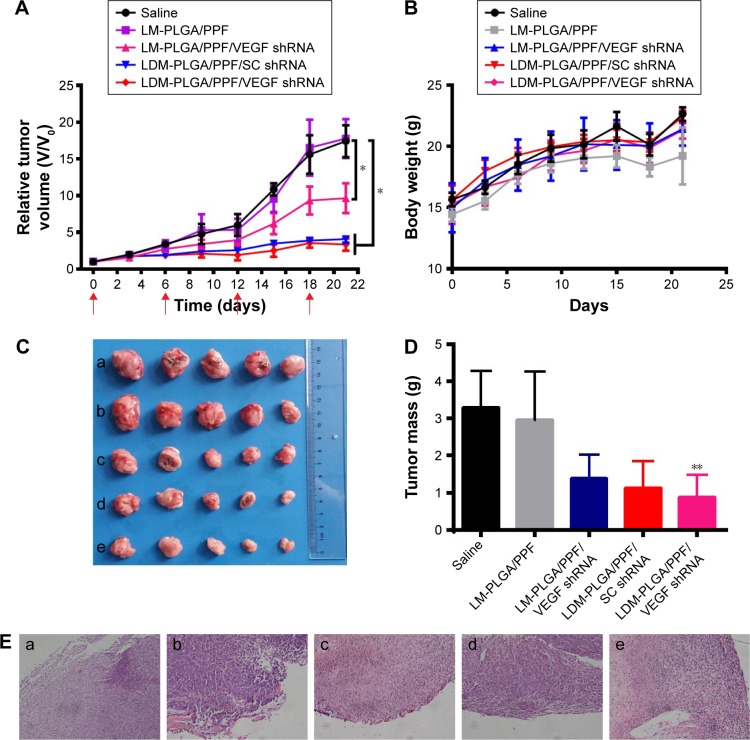
Figure 12.
In vivo antitumor activity.
Notes: (A) Tumor growth curves of the various treatment groups, with the treatment schedule indicated by the red arrows. (B) Body weight changes in mice following the various treatments. (C) Optical images of tumors of different treatment groups: (a) saline, (b) LM-PLGA/PPF, (c) LM-PLGA/PPF/VEGF shRNA, (d) LDM-PLGA/PPF/SC shRNA, and (e) LDM-PLGA/PPF/VEGF shRNA. (D) Weight of dissected tumor tissues from the mice of five groups after the last treatment and sacrifice. (E) Representative H&E-stained tumor sections from the mice of the five treatment groups: (a) saline, (b) LM-PLGA/PPF, (c) LM-PLGA/PPF/VEGF shRNA, (d) LDM-PLGA/PPF/SC shRNA, and (e) LDM-PLGA/PPF/VEGF shRNA on BALB/c mice bearing EMT-6 tumors after the last treatment and sacrifice. *P<0.05 and **P<0.01 compared with the control (saline treatment).
Abbreviations: PLGA, poly(d,l-lactic-co-glycolic acid); PPF, PEI-PEG-FA; PEI-PEG-FA, polyethyleneimine premodified with polyethylene glycol-folic acid; shRNA, small hairpin RNA; VEGF, vascular endothelial growth factor.

