Figure 10.
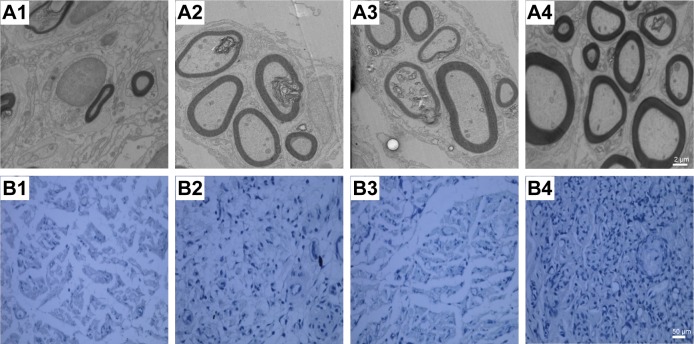
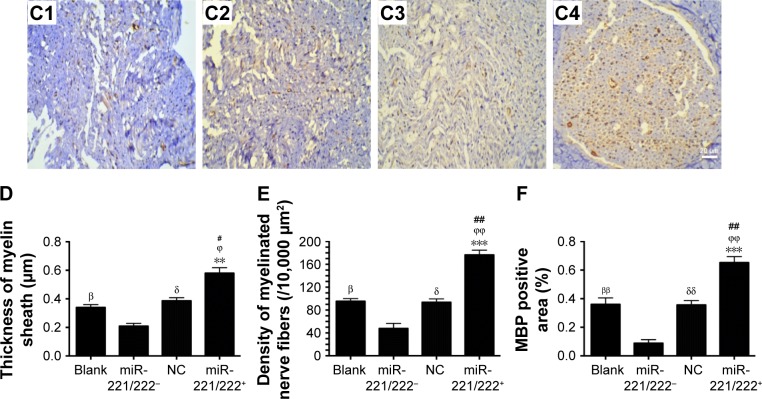
Ultrastructure and immunohistochemistry of the regenerated nerve 4 weeks posttreatment.
Notes: (A1–A4) Histology images by micrographs, scale bar: 2 μm. (B1–B4) Histology images stained with methylene blue, scale bar: 50 μm. (C1–C4) MBP immunohistochemistry of regenerated nerves. The brown spots indicated MBP-positive area, scale bar: 20 μm (A1–C1, miR-221/222− group; A2–C2, the blank group; A3–C3, NC group; A4–C4, miR-221/222+ group). (D) Thickness of myelin sheath. (E) Density of myelinated nerve fibers (/10,000 μm2). (F) MBP-positive area (n=6 in each group. βP<0.05, ββP<0.01 the blank group versus miR-221/222− group; δP<0.05, δδP<0.01 the NC group versus miR-221/222− group; #P<0.05, ##P<0.01 miR-221/222+ group versus the blank group; ϕP<0.05, ϕϕP<0.01, miR-221/222+ group versus the NC group; **P<0.01, ***P<0.001, miR-221/222+ group versus miR-221/222− group).
Abbreviations: MBP, myelin basic protein; TEM, transmission electron microscope.


