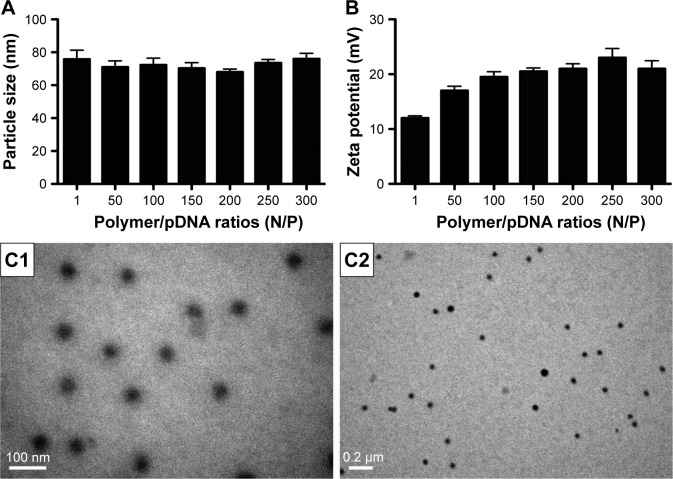
Figure 4.
Characteristics of PDAPEI/pDNA complexes.
Notes: (A) Particle size, (B) zeta potential. Data are shown as the mean ± SD (n=4) (different N/P). (C1 and C2) Morphology of the complexes was measured using the TEM (scale bar: C1, 100 nm; C2, 0.2 μm).
Abbreviations: PDAPEI, PEI (1.8 kDa, branched) derivative with 2,6-pyridinedicarboxaldehyde (PDA) linkage; PEI, polyethylenimine; SD, standard deviation; TEM, transmission electron microscope.

