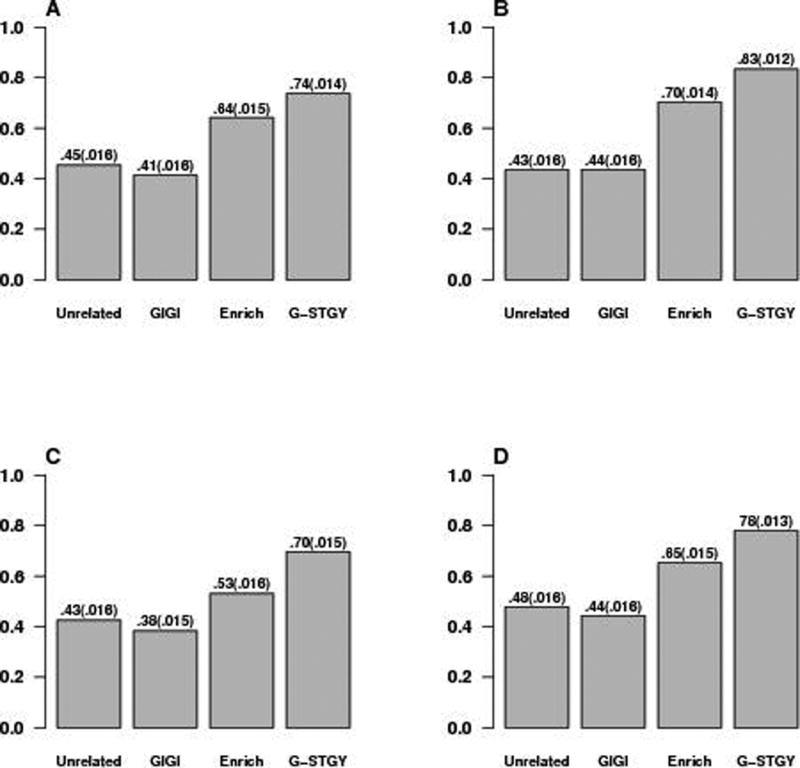
Figure 2. Power Comparison for Selection Strategies in the Case of a Quantitative Trait.

Panels (A), (B), (C), and (D) plot the power for association under quantitative trait models 4a, 4b, 5, and 6, respectively (described in the text and in supplementary Tables S2 and S3). “Unrelated” denotes the Maximally-Unrelated strategy, “GIGI” denotes GIGI-Pick, “Enrich” denotes the Enrichment strategy, and “G-STGY” denotes G-STRATEGY. Each of the four selection methods is implemented to select n = 300 individuals to be genotyped from among the 960 individuals in the sample. Empirical power for each model is based on 1,000 replicates with analysis performed using MASTOR. Standard errors are given in parentheses.
