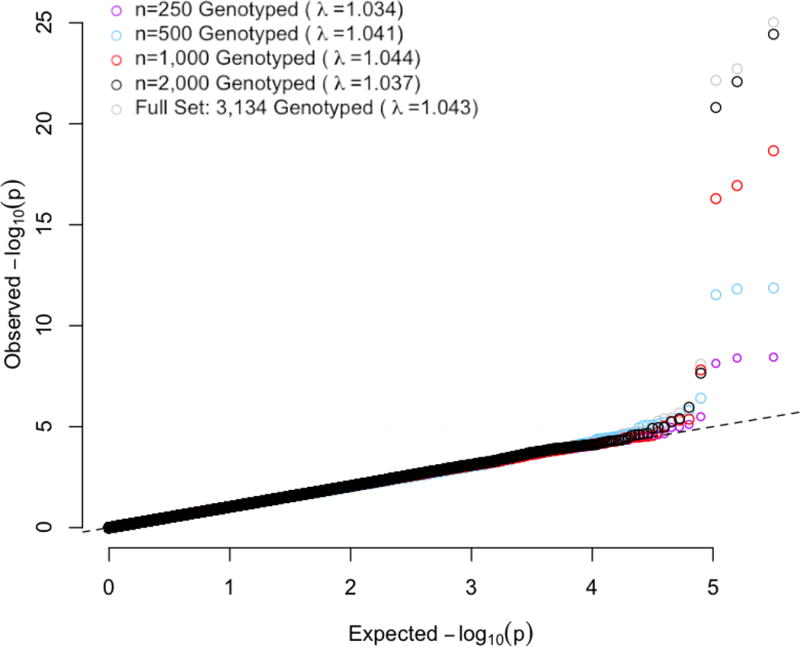
Figure 3. Q-Q Plots with Genomic Control Coefficients from GWAS for HDL, Based on G-STRATEGY Subsets of Different Sizes.

G-STRATEGY is implemented to select a subset of size n = 250, 500, 1,000 or 2,000 individuals to be genotyped from among the 3,134 individuals. The dashed line represents the values expected under the null hypothesis. The gray circles represent the benchmark in which all 3,134 genotyped individuals are selected. GWAS analysis is performed using MASTOR based on each resulting sample.
