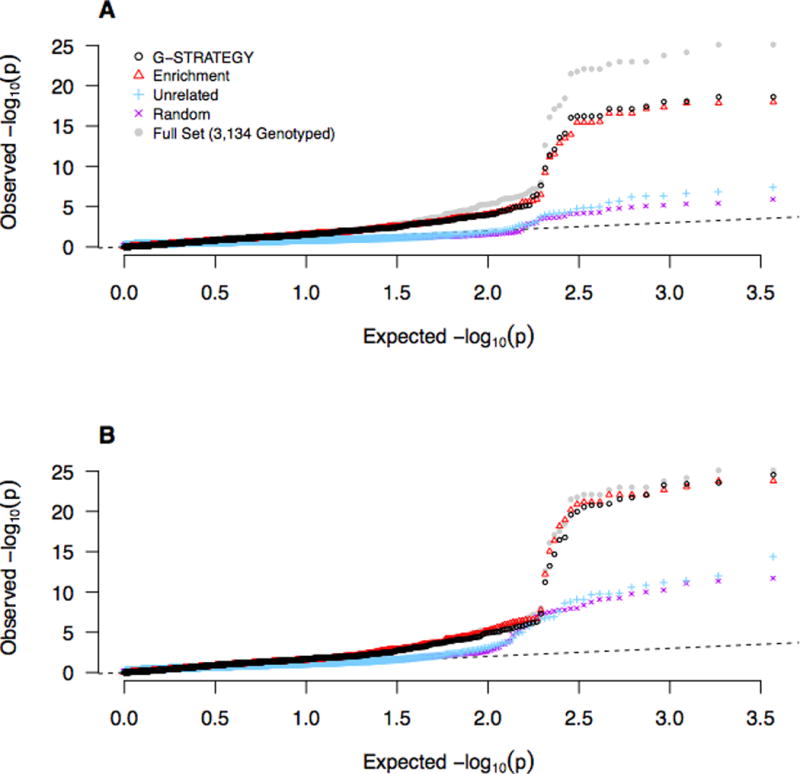
Figure 4. Q-Q Plots of HDL p-values for SNPs in Candidate Genes, Based on Different Selection Methods.

We test for association at ~3,700 SNPs that are located with within 13 candidate loci (comprising 19 candidate genes) for HDL. For each of the four selection methods, the reported p-value is the geometric mean of the corresponding p-values at each SNP over 20 runs. The p-values in Panel (A) are based on selection of n = 1,000 individuals to be genotyped, and the p-values in Panel (B) are based on selection of n = 2,000 individuals to be genotyped. The dashed line represents the values expected under the null hypothesis. The gray dots represent the benchmark in which all 3,134 genotyped individuals are selected.
