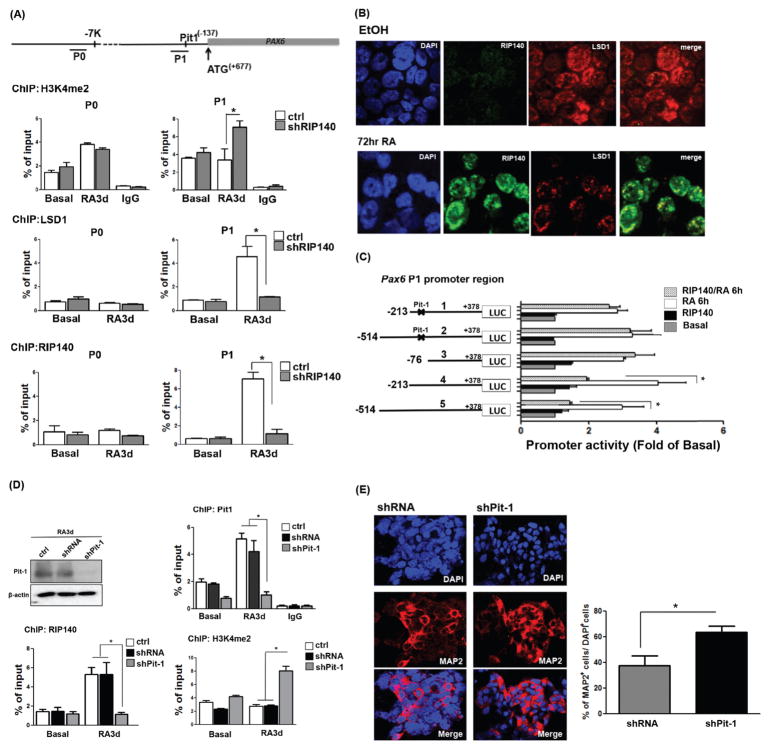
Figure 2.
Retinoic acid (RA) treatment induces RIP140/LSD1 complex formation to repress Pax6 gene expression through Pit-1. (A): Top: Diagram of the 5′-flanking region of the Pax6 gene. Lines under the map indicate the two regions (P0 and P1) in chromatin immunoprecipitation (ChIP) analysis. Lower: ChIP assays for H3K4me2, LSD1, or RIP140 on the Pax6 promoter in control (ctrl) and RIP140-silenced (shRIP140) embryonic stem cells (ESCs) untreated or treated with RA for the indicated times. Experiments were performed in triplicate. (B): Immunofluorescence staining of RIP140 (green) and LSD1 (red) in ESCs treated with RA (3 days). (C): Left: Pax6 Luc P1 promoter constructs, with Pit-1 mutation indicated with x marks. Right: Reporter (wild-type, truncated or the Pit-1 mutated) activities assayed in ESCs in the absence or presence of RIP140, and treated with vehicle (basal) or RA for 6 hours. (D): ChIP assays for Pit-1, RIP140, or H3K4me2 on Pax6 promoter in control (ctrl), shRNA vector-transfected (shRNA), and Pit-1-silenced (shPit-1) ESCs untreated or treated with RA for the indicated times. Experiments were performed in triplicate. (E): Cultures differentiated from shRNA- and shPit-1-treated embryoid bodies were stained with MAP2 (left panel), and nuclei were visualized by DAPI staining. Total cells (DAPI+) and MAP2-positive neurons in five randomly selected areas were scored (n = 3 or more) (right panel). Asterisks denote a statistically significant difference (p < .05).

