Fig. 2.

A typical single CFD contour (a) and a 2-D slice of test area in a white dashed box (b) at the inlet flow rate of 10 ml min−1 condition. The arrows on the channel indicate the flow direction of corrosion medium in the bioreactor.

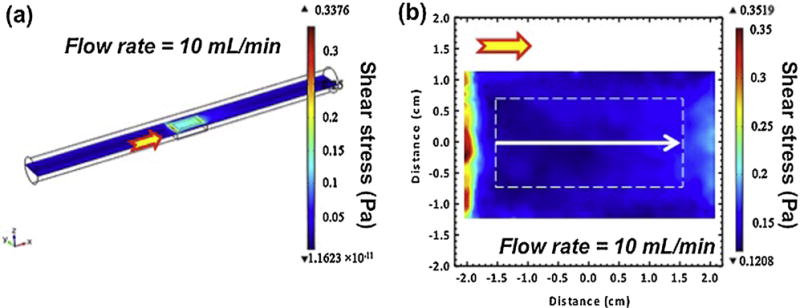
A typical single CFD contour (a) and a 2-D slice of test area in a white dashed box (b) at the inlet flow rate of 10 ml min−1 condition. The arrows on the channel indicate the flow direction of corrosion medium in the bioreactor.