
Fig. 4.
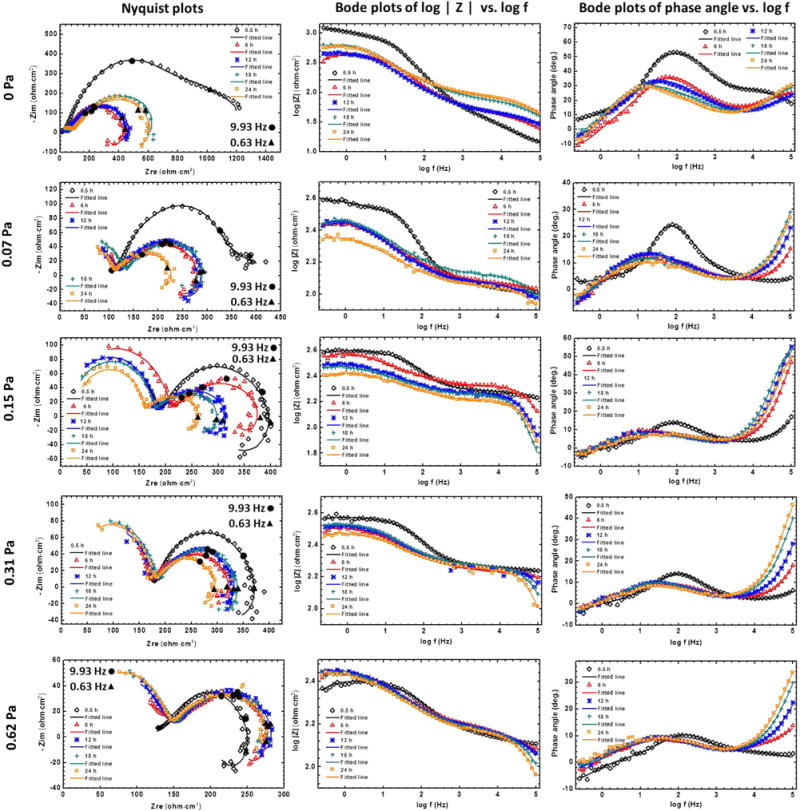
EIS and fitted results for Mg alloys as the functions of time and FISS: Nyquist plots, bode plots of |Z| vs. frequency, and bode plots of phase angle vs. frequency. Symbols represent experimental values, whereas lines represent simulated spectra.