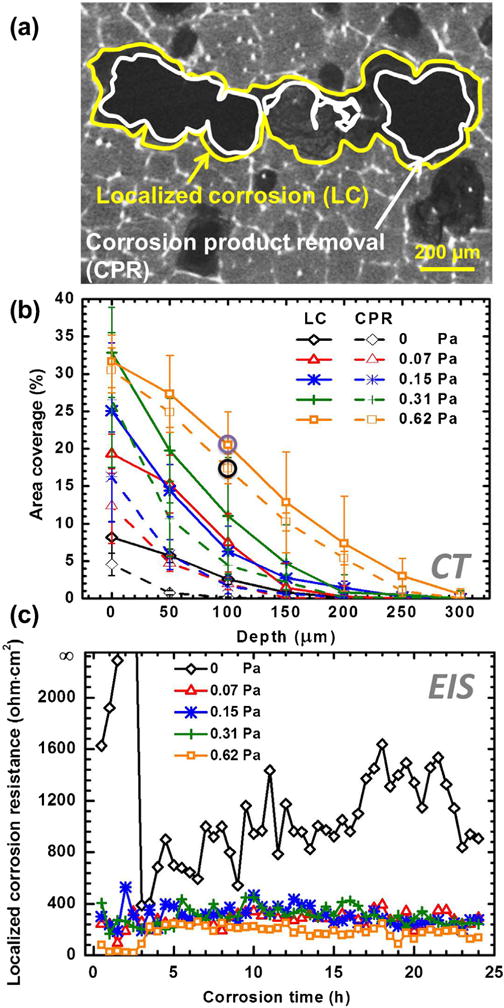
Fig. 8.

(a) Typical 2-D CT slice of the localized corrosion coverage region (yellow) and corrosion product removal coverage region (white) of sample at the depth of 100 μm at 0.62 Pa for 24 h. (b) LCCR and CPRCR of all the samples at 50 μm depth intervals for 24 h. The data marked with purple and black circles represent by LC and CPR regions (a). (c) The resistances of localized corrosion as the functions of time and FISS. RL at 0 Pa for 2 and 2.5 h are close to 20000 Ω cm2. (For interpretation of the references to color in this figure legend, the reader is referred to the web version of this article).
