
Figure 3.
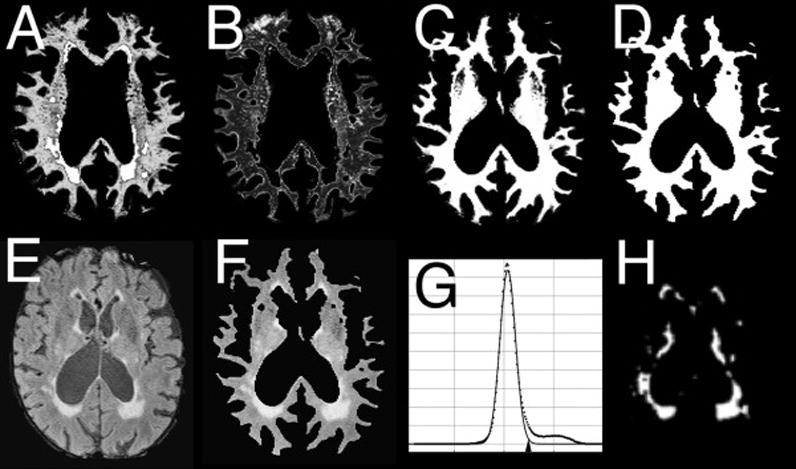
Sequential steps of the segmentation process to quantitate WMH. A, B: segmented images representing two tissue classes of WM; C: total WM (A+B); D: WM mask from thresholding of D; E: FLAIR image; F: FLAIR image masked by D (FLAIR WM voxels); G: histogram of E showing Gaussian-fit and threshold of 3.0 S.D. (arowhead); H: WMH image obtained by applying threshold to F.