
Figure 5.
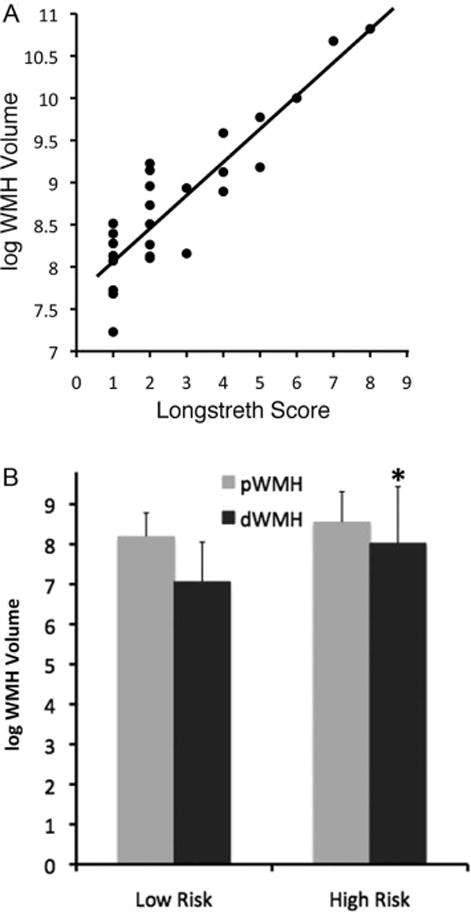
(A) Linear regression of Longstreth visual rating scale (0–9) for all patients on log WMH total volume, demonstrating face validity of the WMH volume measurement (adjusted r2= 0.88, p<0.0001), (B) log WMH volume in low and high risk groups; overall volume is higher in high-risk patients (p=0.02), but only the dWMH volume is significant (p = 0.04; error bars = SD, asterisk *).