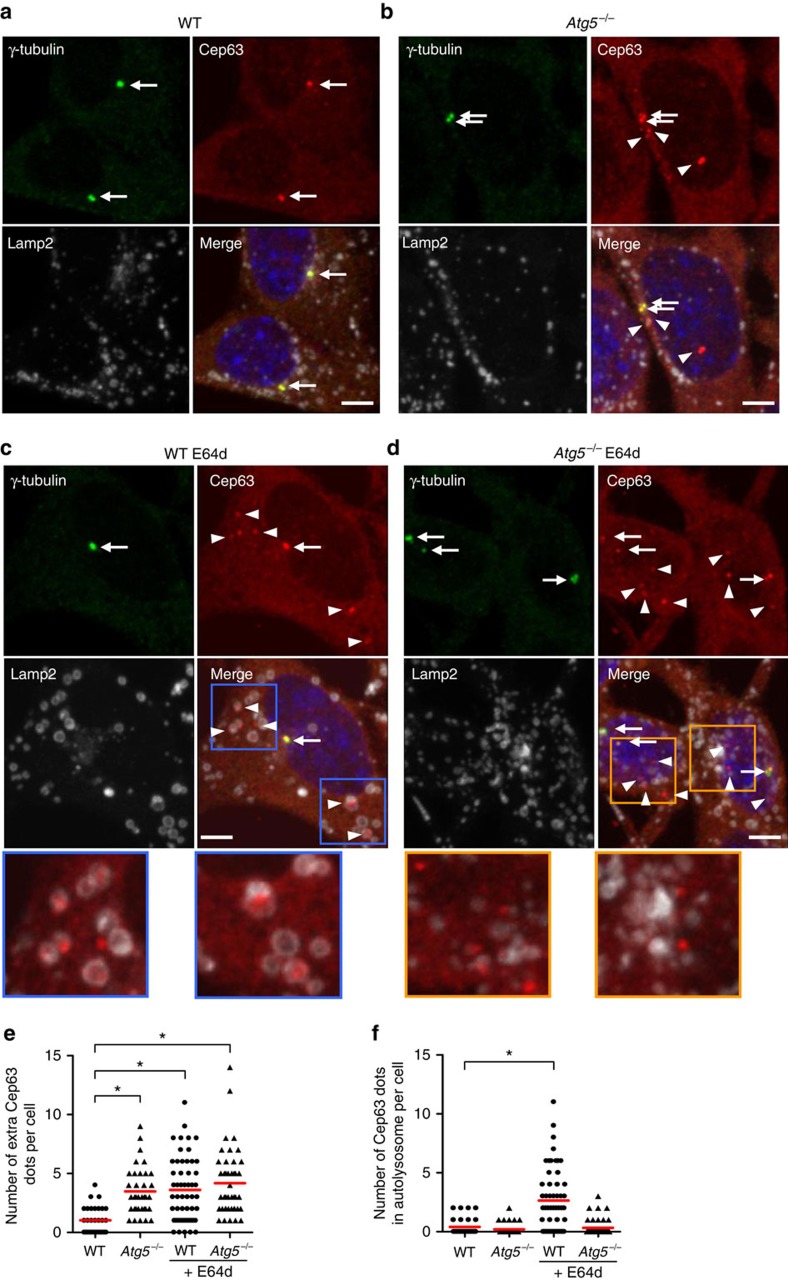
Figure 2. Regulation of extra Cep63 dots by autophagy.
(a–d) The WT (a,c) and Atg5−/− MEFs (b,d) were treated with (c,d) or without (a,b) 10 μg ml−1 of E64d. The cells were then immunostained with anti-γ-tubulin, anti-Cep63 and anti-Lamp2 antibodies and were examined by fluorescence microscopy. Representative images of γ-tubulin (green; upper left), Cep63 (red; upper right), Lamp2 (white; lower left) and the merged image (lower right) are shown. Arrows and arrowheads indicate mature centrosomes and extra Cep63 dots, respectively. Scale bar, 5 μm. Magnified images in the squares are shown below. Extra Cep63 dots increased in the Atg5−/− MEFs and E64d-treated MEFs and were enclosed by Lamp2 vacuoles in the E64d-treated WT MEFs but not in the Atg5−/− MEFs. (e) The number of extra Cep63 dots per cell was calculated (n>30 cells). The red lines indicate mean values. Asterisks indicate a significant difference (P<0.05, analysis of variance (ANOVA) Tukey's post hoc test). (f) The number of Cep63 dots enclosed by Lamp2 vacuoles was calculated (n>30 cells). The red lines indicate the mean value. Asterisk indicates a significant difference (P<0.05, ANOVA Tukey's post hoc test).

