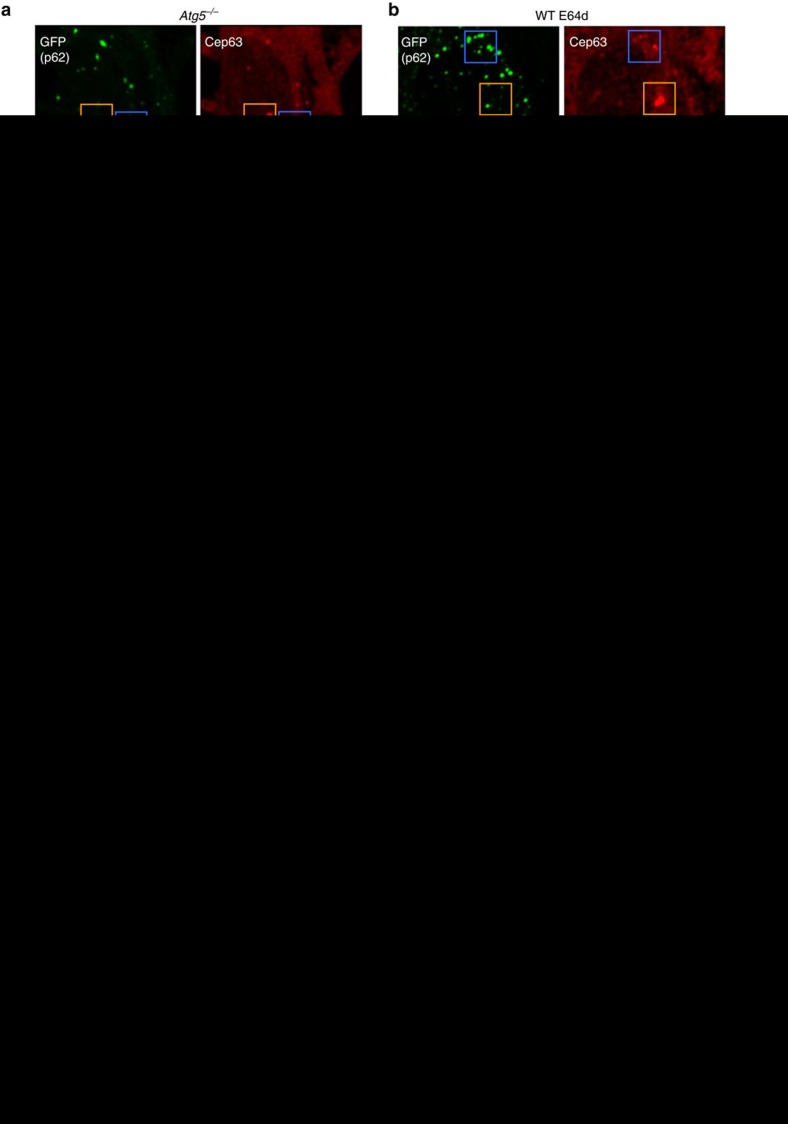
Figure 4. Interaction between Cep63 and p62.
(a–c) The colocalization of p62 and Cep63 in extra Cep63 dots, but not mature centrosomes. (a) Atg5−/− MEFs transfected with GFP–p62 were immunostained with anti-GFP, anti-Cep63 and anti-γ-tubulin antibodies. The mature centrosome containing γ-tubulin did not merge with p62 (orange squares), whereas extra Cep63 dots without the presence of γ-tubulin merged with p62 (blue squares). The magnified images of each structure are shown at the bottom. Arrowheads indicate Cep63 dots colocalizing with p62. Arrow indicates mature centrosome without colocalizing p62. (b) The same experiment was performed using E64d-treated WT MEFs, instead of Atg5−/− MEFs. (c) The number of Cep63 dots colocalizing with p62 was calculated (n>25 cells). Red lines indicate mean values. (d–f) The interaction of p62 with Cep63. Lysates from GFP–Cep63-expressing MEFs (d) and Flag(3 × )–Cep63-expressing MEFs (e) were immunoprecipitated with anti-p62 antibody and normal IgG. In f, in vitro-translated p62 and in vitro-translated Flag–Cep63 proteins were incubated and also immunoprecipitated with anti-p62 antibody and normal IgG. The immune complexes were then analysed by western blotting using anti-GFP, anti-Flag and anti-p62 antibodies. ‘Total' indicates 5% of the lysates subjected to immunoprecipitation. Uncropped images are shown in Supplementary Fig. 14. (g,h) Close proximity assay between Cep63 and p62. (g) The WT, Atg5−/− and p62−/− MEFs were transiently transfected with Flag(3 × )–Cep63 for 24 h, and the Cep63–p62 interaction was visualized using anti-Flag and anti-p62 antibodies with a Duolink detection kit. Red signals indicate positive interaction. In the lower right panel, a quantitative analysis of signal intensity is shown. The signal area per cell was calculated from >50 cells using In Cell Analyzer. Data are shown as proportions of the value of WT (mean+s.d.). (h) Experiments similar to that shown in g were performed using the p62−/− MEFs. Scale bar, 5 μm (a,b) and 10 μm (g,h). In (c,g,h), *P<0.05, analysis of variance Tukey's post hoc test. ‘NS' indicates no significant difference (n=3).

