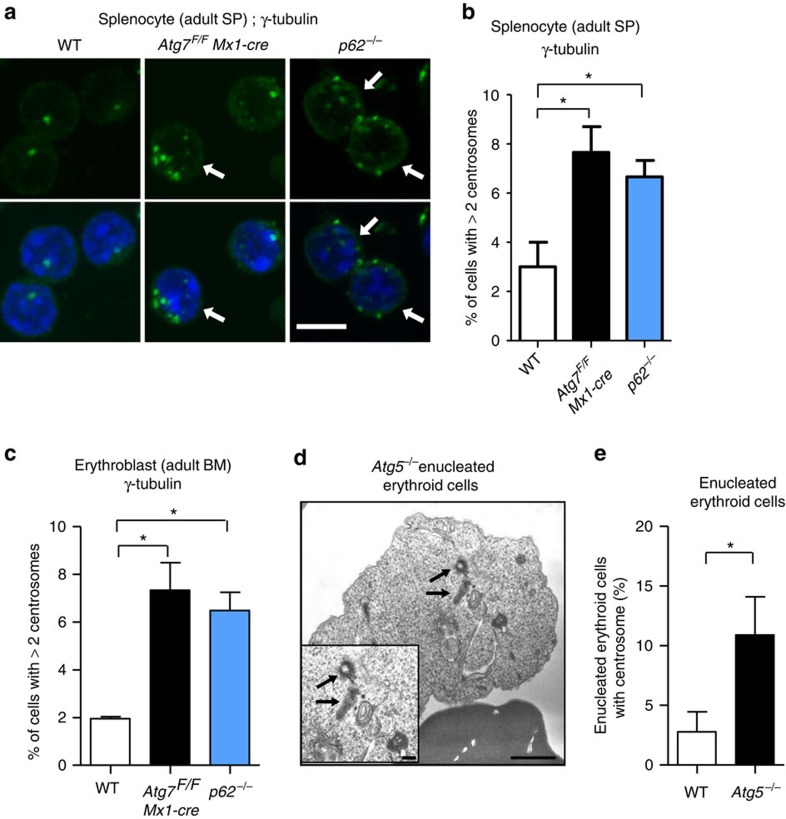
Figure 6. Increase in the number of centrosomes in autophagy-deficient and p62−/− mice.
(a,b) Increase in the number of centrosomes in autophagy-deficient and p62−/− mice. Splenocytes were isolated from the indicated mice at the age of 20 weeks, and centrosomes were stained with anti-γ-tubulin antibody. Representative images are shown in a. Centrosomes were stained green. The nucleus was stained with 4,6-diamidino-2-phenylindole (DAPI) (blue). Arrows indicate cells with extra centrosomes. Scale bar, 5 μm. (b) The percentage of cells with three or more centrosomes was calculated. Data are expressed as the mean+s.d. (n=3). Asterisks indicate a significant difference (P<0.05, analysis of variance (ANOVA)). (c) Bone marrow erythroblasts were isolated from the indicated mice at the age of 20 weeks, and centrosomes were stained with an anti-γ-tubulin antibody. Then, the percentage of cells with three or more centrosomes was calculated. Data are expressed as the mean+s.d. (n=3). Asterisks indicate a significant difference (P<0.05, ANOVA). Note that the erythroblasts were isolated at 2 weeks after PIPC injection in the experiments of Atg7 cKO mice, when Atg7 was almost completely deleted from hematopoietic cells. (d,e) Enucleated erythroid cells from the indicated mouse embryos at embryonic day 14.5 were analysed by electron microscopy (EM). A representative EM image of an Atg5−/− erythrocyte is shown in d. Centrioles are clearly observed (arrows). Scale bar, 1 μm. A magnified image is shown in the inset. Scale bar, 0.1 μm. (e) The percentages of enucleated erythroid cells with centrosomes were calculated from the EM images (n=50 cells each). Data are shown as the mean+s.d. (n=3). The asterisk indicates a significant difference (P<0.05, Student's t-test).

