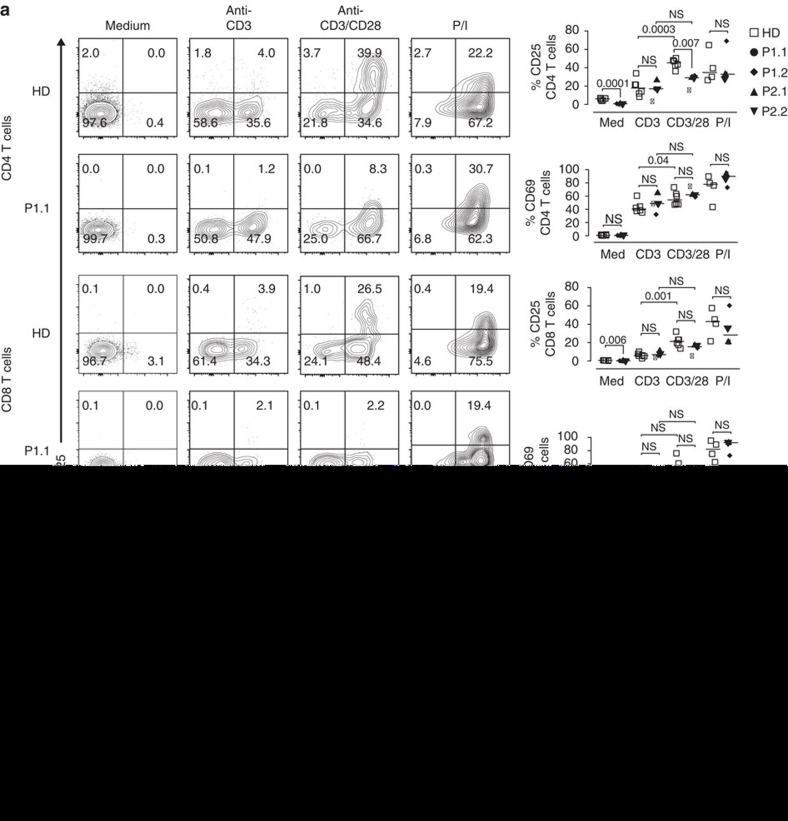
Figure 4. CARMIL2-deficiency impairs CD28-mediated T-cell activation.
(a) Representative contour plots of CD25 and CD69 surface expression on CD4 and CD8 T cells without (medium) and after stimulation for 48 h with anti-CD3, anti-CD3/CD28 or PMA/ionomycin (P/I). Summary of CD4 and CD8 T-cell CD25 and CD69 surface expression for six HD (open squares), P1.1 (black circle), P1.2 (black rhomb), P2.1 (black up-pointing triangle) and P2.2 (black down-pointing triangle). (b) Contour plots of CD25 surface and FOXP3 expression on CD4 T cells without (medium) and after stimulation for 48 h with anti-CD3, anti-CD3/CD28 or PMA/ionomycin (P/I). Summary of CD4 T-cell CD25 surface and FOXP3 expression for four HD and three patients. Corresponding percentages are indicated in each square. Data are representative for four independent experiments with n=2 (a) or two independent experiments with n=2 (b). Small horizontal lines indicate the median. Each symbol represents an individual donor. Significance levels are calculated with Welch's t-test and indicated in the summary graphs (NS=non significant).

