
Figure 5.
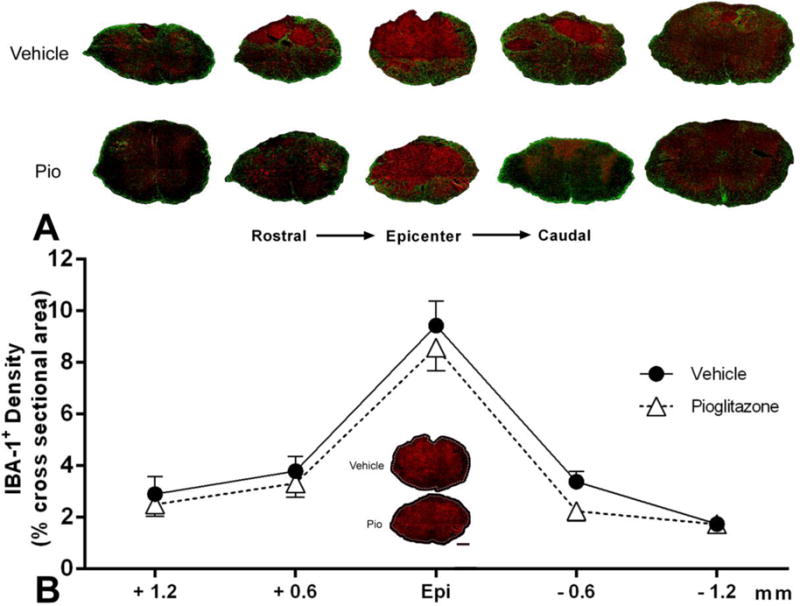
Effect of pioglitazone (Pio) treatment on microglia/macrophage activation 4 weeks after contusion SCI. A. Representative photomicrographs across injured spinal cord levels illustrate similarities in activated IBA-1+ microglia/macrophage responses (red) in pioglitazone-and vehicle-treated spinal cords, despite differences in spared tissue identifiable by the GFAP+ glial scar (green). B. Photomicrographs of IBA-1+ immunoreactivity at the injury epicenter are shown in the graph inset; the entire region of interest is outlined. Image analysis throughout the cross-sectional area of tissue sections at the injury epicenter (Epi), as well as 0.6 mm and 1.2 mm rostral and caudal, showed no significant differences (p>0.05) across spinal levels. Symbols represent means ± SEM, n = 10–12 per group. Scale Bar = 200μm.