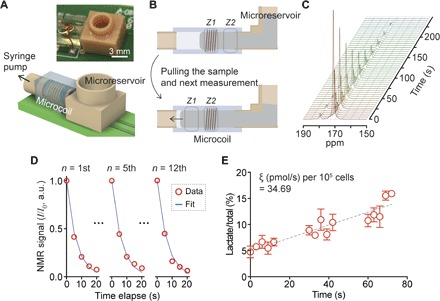
Fig. 6. HMRS integrated with a microfluidic system for multiple analyses.

(A) Schematic of the integrated HMRS platform. (B) Assay schematic. (C) Sequential spectra of hyperpolarized pyruvate collected from multiple analyses. (D) Quantification and comparison of NMR signals from 12 analyses. NMR signal in each analysis (I) was normalized by the first signal of the same analysis (I0). All data sets were fitted to a single model of decay of hyperpolarized spin states. The 12 analyses yielded an R2 of 99.5 ± 0.4% and an RMSE of 3.07 ± 1.05%. (E) Multiple analyses of glycolytic flux from a single dissolution of hyperpolarized pyruvate. Each analysis consists of five NMR acquisitions (15 s in total), followed by a 15-s interval to stabilize the sample after movement. The overall glycolytic flux metric ξ was 34.69 (pmol/s) per 105 cells, which was well matched to the ξ of K562 (33.24 ± 2.51) presented in Fig. 3B. The measurements were performed in triplicate. Error bars show the SD.
