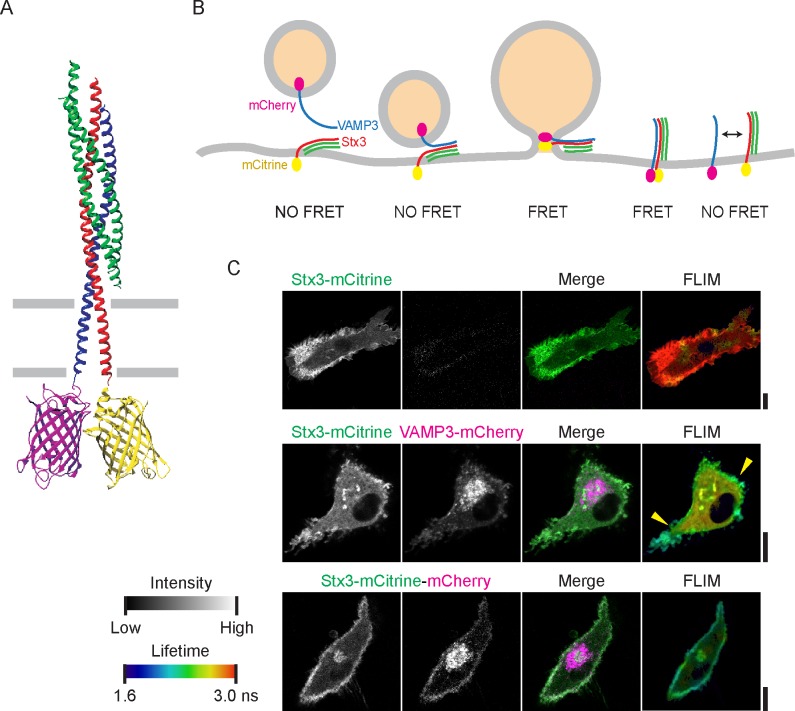
Figure 1. SNARE complex formation by FRET-FLIM.
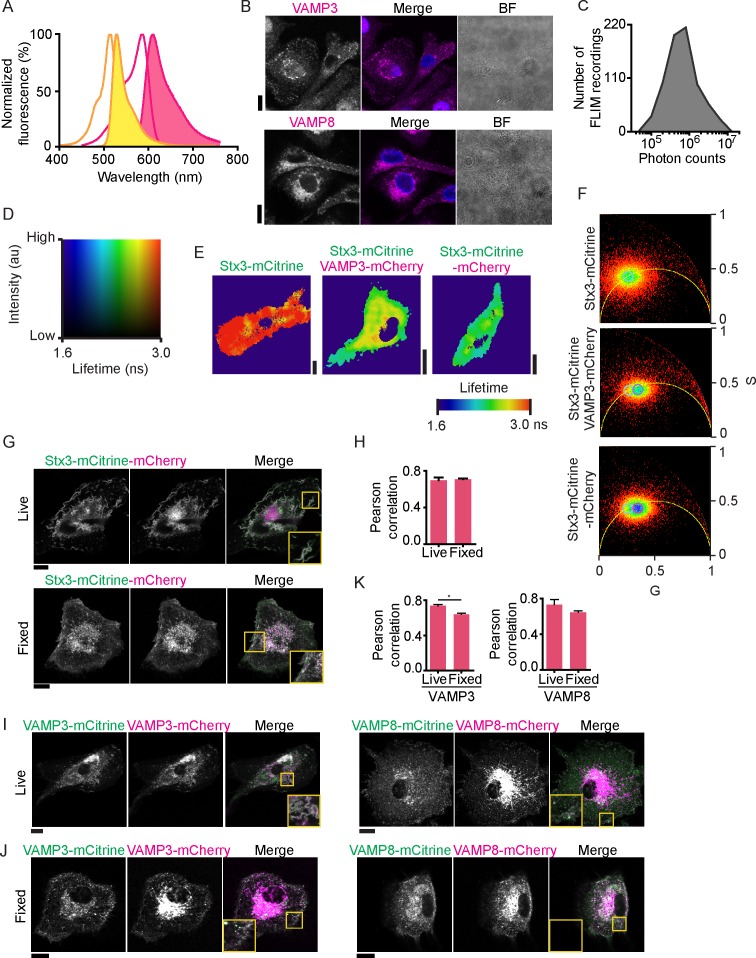
(A) Model of the neuronal SNAREs (crystal structure; protein database 3HD7 [Stein et al., 2009]) with the C-termini of syntaxin 1 (red) conjugated to mCitrine (3DQ1 [Ho et al., 2008]; yellow) and VAMP2 (blue) conjugated to mCherry (2H5Q [Shu et al., 2006]; magenta). mCitrine (donor fluorophore) and mCherry (acceptor) are within 3 nm proximity resulting in FRET. Green: SNAP25. (B) Scheme of membrane fusion resulting in FRET. (C) Representative confocal microscopy (left) and FLIM (right) images of dendritic cells expressing Stx3-mCitrine (green in merge; upper panels), Stx3-mCitrine with VAMP3-mCherry (magenta; middle panels), or Stx3 conjugated to both mCitrine and mCherry (Stx3-mCitrine-mCherry; lower panels). Apparent fluorescence lifetimes of Stx3-mCitrine with VAMP3-mCherry were lowest at the cell membrane (yellow arrowheads). Scale bars, 10 µm. Full lifetime/intensity lookup table and lifetime images are in Figure 1—figure supplement 1D–E.


