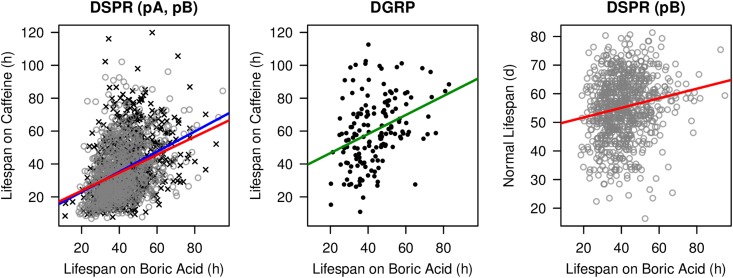
Figure 2.
Phenotypic correlations in the DSPR and DGRP. Boric acid resistance data are from the current study, resistance to caffeine is from Najarro et al. (2015), and lifespan data under no-drug conditions (available for DSPR pB only) is from Highfill et al. (2016). Each point represents the mean phenotype of a single line from the DSPR pA (black cross), DSPR pB (gray open circle), and DGRP (black filled circle) populations. Only those strains with data from all relevant phenotypes are shown (822 DSPR pA RILs, 796 DSPR pB RILs, and 154 DGRP lines). Correlations between phenotypes are shown with colored lines: DSPR pA (blue), DSPR pB (red), and DGRP (green). Boric acid and caffeine resistance are highly correlated in both the DSPR (r = 0.37, P < 10−15) and DGRP (r = 0.36, P < 10−5). Boric acid resistance shows a more modest relationship with normal lifespan in DSPR pB RILs (r = 0.17, P < 10−6). DGRP, Drosophila Genetic Reference Panel; DSPR, Drosophila Synthetic Population Resource; RILs, Recombinant Inbred Lines.

