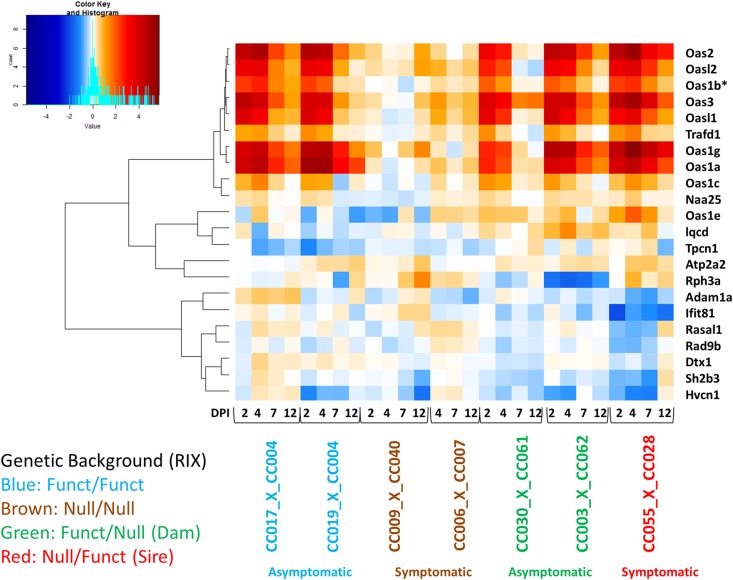
Figure 5.
Heatmap of QTL genes. Coexpression in spleen at days 2, 4, 7, and 12 postinfection. The heatmap represents differential expression of 21 genes found under the QTL across seven F1s with different Oas1b haplotype (F/F, N/N, F/N, and N/N). Expression is shown as log2(FC) WNV infected relative to mock. Red marks genes that are upregulated, blue for downregulated, and white represents no log2(FC). The y-axis shows genes that coregulate based on their directionality and magnitude. The x-axis shows the days postinfection, haplotype, and disease outcome according to the legend. log2(FC), log2 fold change; QTL, quantitative trait loci; RIX, recombinant inbred intercross; WNV, West Nile virus.

