Figure 1.
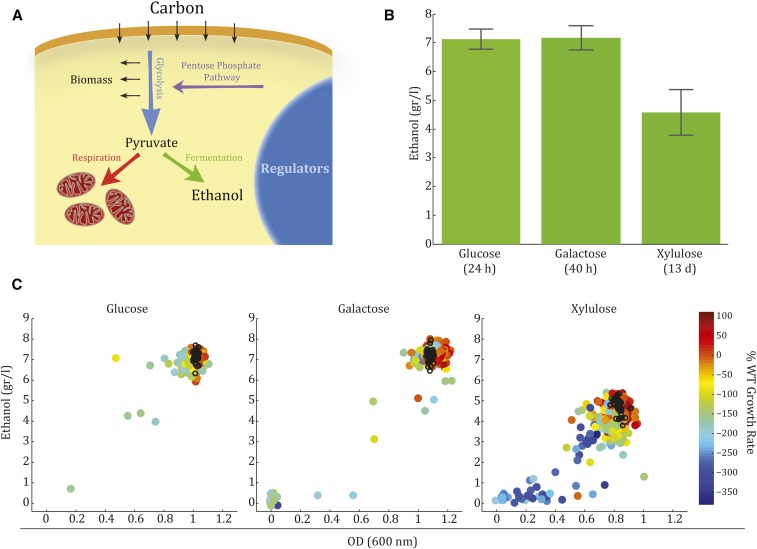
Ethanol production on xylulose differs from glucose and galactose in yield and variability. (A) A schematic overview of carbon metabolism pathways in yeast. Shown are the major metabolic pathways discussed, which include the genes included in our screen. (B) Wild-type (WT) cells produce different amounts of ethanol from different carbon sources. Shown are the amounts of ethanol produced by WT yeast grown on synthetic complete media with each of the three carbon sources used in the screen. Cells were grown until all of the sugar in the media was consumed (24 hr on glucose, 40 hr on galactose, and 13 d on xylulose) and the amount of ethanol produced was measured by high-performance liquid chromatography analysis. (C) Variability of ethanol production differs dependent on carbon source. The amount of ethanol produced by each of the deletion strains during growth on each of the carbon sources examined is shown vs. their final OD at stationary phase. The color code depicts the percentage of growth rate of the WT strain, as determined by a sensitive competition assay.

