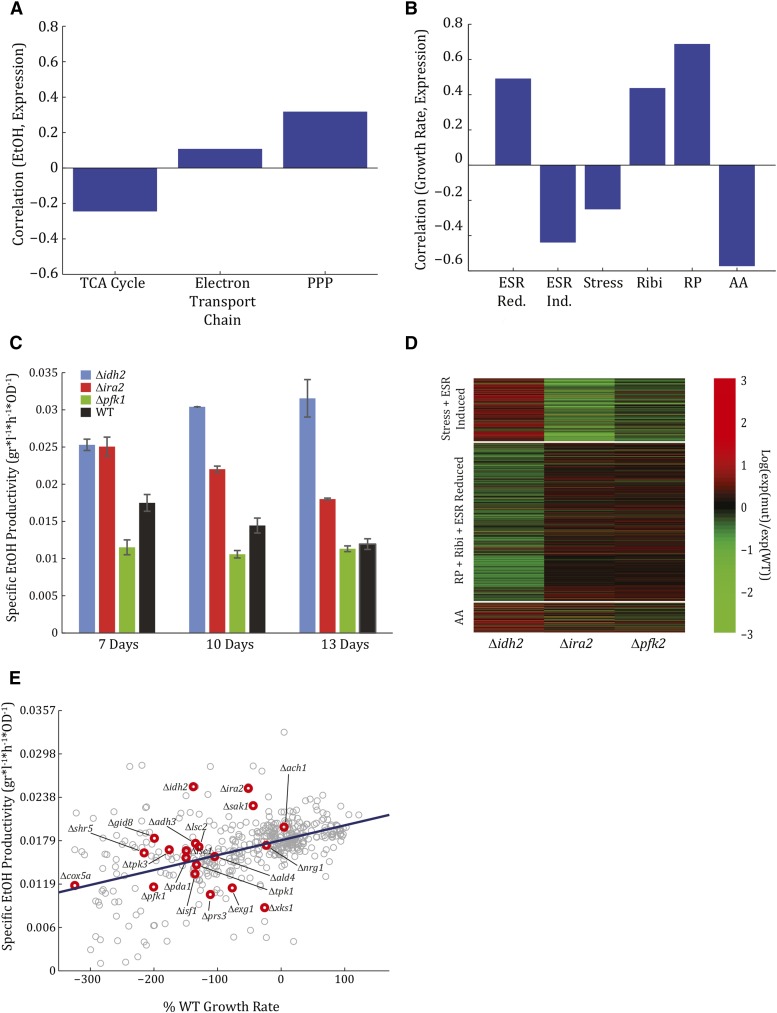
Figure 4.
Mutant expression patterns do not correlate with ethanol production, growth rate, or phenotype. (A) Mutant expression patterns do not correlate with ethanol production. Shown is a bar plot of the correlation between mean expression levels of genes belonging to the tricarboxylic acid (TCA) cycle, electron transport chain, and pentose phosphate pathway (PPP) vs. the amount of ethanol produced by each deletion strain. Expression is defined as the difference (log ratio) between each deletion strain and the wild-type (WT). (B) Mutant expression patterns do not correlate with growth rate. Shown is a bar plot of the correlation between mean expression levels of genes belonging to the environmental stress response (ESR)-induced, ESR-reduced, amino acid biosynthesis (AA), ribosomal proteins (RP), ribosomal biosynthesis (Ribi), and stress genes vs. the strains’ growth rate compared to the WT. Expression is defined as the difference (log ratio) between each deletion strain and the WT. (C) Specific ethanol productivity of Δira2, Δidh2, and Δpfk1 when grown on xylulose over time. Shown is the specific ethanol productivity after 7, 10, and 13 d of growth for each of the mutants as well as the WT. (D) Expression patterns of Δira2, Δidh2, and Δpfk1 during logarithmic growth on xylulose. Difference (log ratio) between expression on xylulose of each deletion strain and the WT, of genes belonging to the AA, RP, Ribi, ESR-reduced, ESR-induced, and stress gene modules. (E) Specific ethanol productivity positively correlates with growth rate. Shown is specific ethanol productivity measured after 7 d of growth vs. percent of WT growth rate for all mutants screened. Candidate mutants whose phenotypes were validated are depicted in red.

