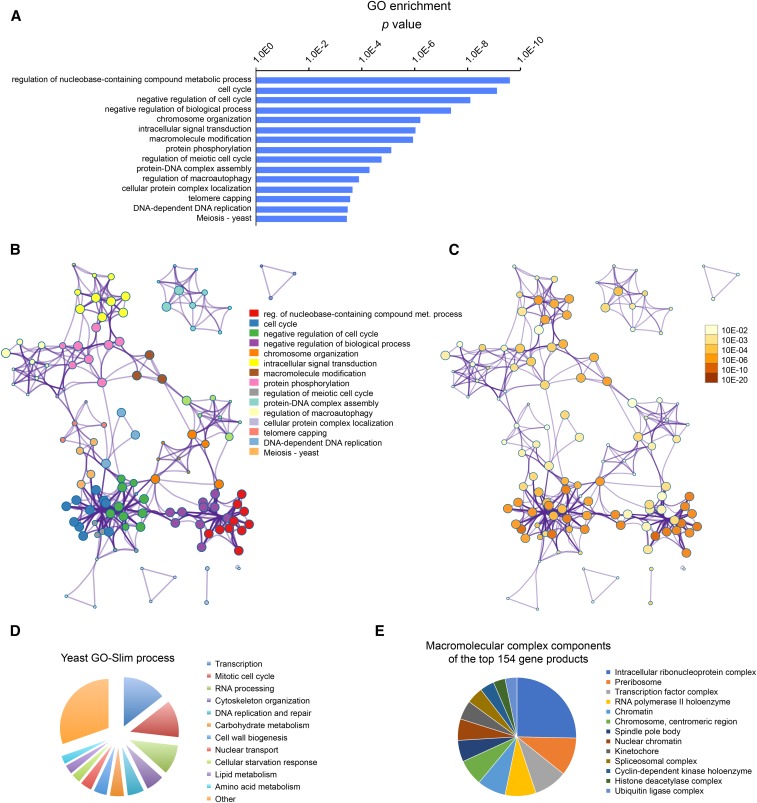
Figure 3.
Analysis of the data reveals overrepresentation of genes involved in the cell cycle, DNA metabolism, and transcription. (A) GO Biological Process analysis of the genes that aggravate the cdc28-as1 phenotype (negative SDL interactions). GO analysis was performed using Metascape. (B) Network plot of the relationships among GO terms. Nodes represent enriched terms colored by its cluster ID. (C) The same network as presented in (B) but showing P values for the nodes. (D) Analysis of the negative SDL interactors using the GO Slim mapper tool of the SGD. (E) Analysis of the macromolecular complex components of the top 154 genes in the SDL network. Only those GO terms are shown for which at least five terms genes were identified. GO, gene ontology; ID, identifier; SDL, synthetic dosage lethality; SGD, Saccharomyces Genome Database.

