Figure 3.
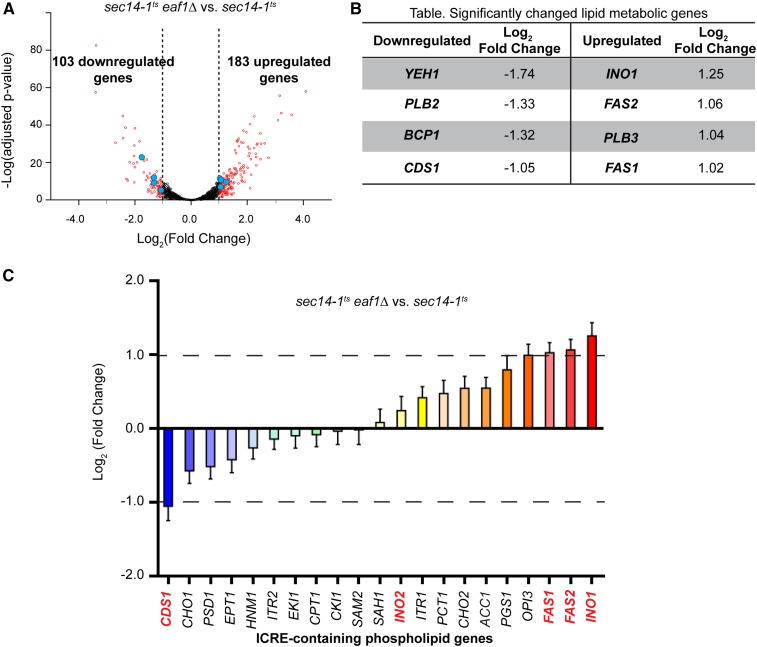
Transcriptional profiling of sec14-1tseaf1Δ reveals that most ICRE-regulated phospholipid genes are not significantly derepressed. (A) Volcano plot for differentially expressed genes, sec14-1tseaf1Δ (YKB3935) vs. sec14-1ts (YKB3144), from RNA sequencing experiments. Differential expression levels of aligned sequences were calculated using significant thresholds set at log2 fold change over two and FDR adjusted p-value ≤ 0.05. Significant differentially expressed genes are in red. Blue shows the significantly changed lipid metabolic genes described in (B). (B) Table listing significantly downregulated and upregulated lipid metabolic genes. (C) Relative expression levels of ICRE-containing phospholipid genes between sec14-1tseaf1Δ and sec14-1ts. Genes are ordered from lowest to highest fold-change expression. Genes in red are discussed further in the text.

