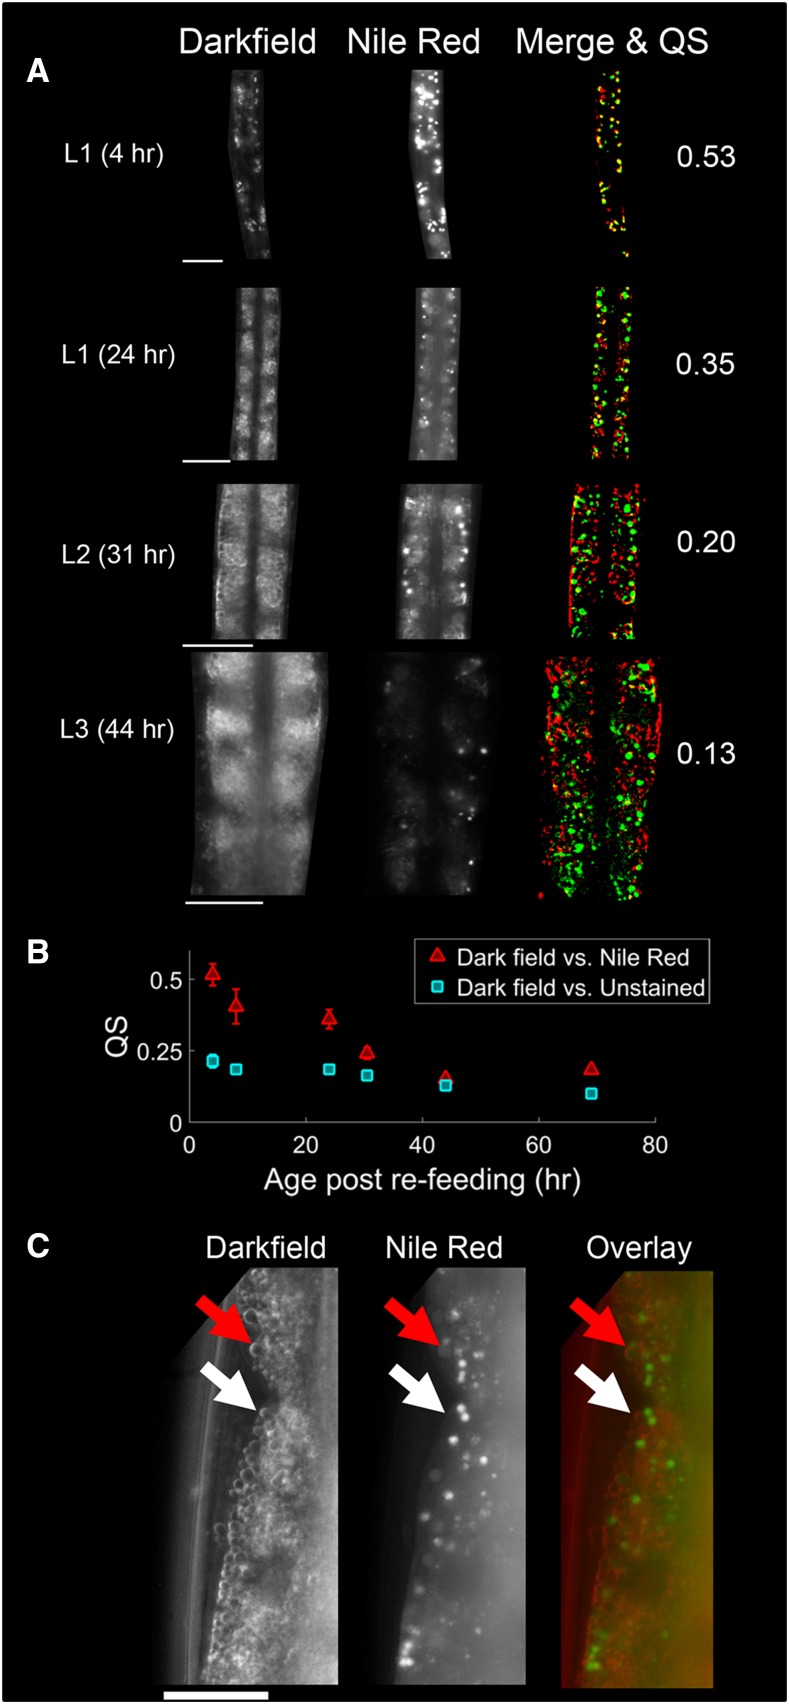
Figure 4.
Scattering in L1 worms corresponds to gut granules; scattering in older worms does not. (A) Representative dark field and Nile Red images from individual worms of all four larval stages, acquired through a 63 × objective. Images were manually segmented to isolate the worm. The merge images show the overlap between the brightest pixels in each image. Red corresponds to dark field, green to Nile Red fluorescence, and yellow to overlapped regions. The corresponding Sørenson–Dice coefficient (QS) value is shown at right. All scale bars are 20 µm. (B) Mean QS, the average overlap between bright pixels in dark field and Nile Red images, decreases as a function of age. QS was also computed for control worms that were unstained, but imaged under the same fluorescence parameters [not shown in (A)]. N = 9–13 worms per point; error bars represent SEM. (C) High-resolution dark field and Nile Red images of an adult (69 hr) intestine. Layers of lipid droplets are plainly visible in the dark field image, and most do not colocalize with lysosome-related organelles (LROs). Similar droplets are also visible in some L2 and L3 dark field images (see (A)), and in mutants lacking LROs (see Figure S2 in File S2). White arrows, droplet that does not colocalize with Nile Red. Red arrows, droplet that colocalizes with a nonpuncta Nile Red signal.

