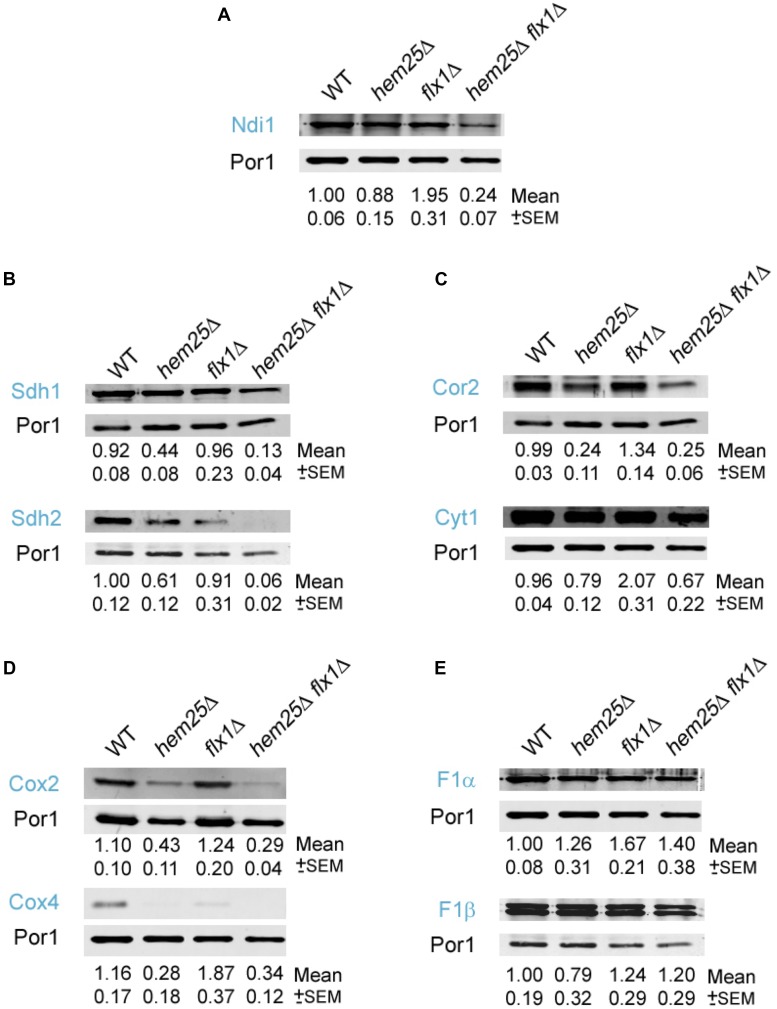
Figure 6.
Specific components of the electron transport chain are significantly decreased in hem25Δ cells lacking the FAD importer FLX1. Cells of the indicated genotypes were grown to an OD of 1.0 in defined medium with raffinose. Cells were then transferred and grown in lactate for 5 hr. Cells were harvested and mitochondrial fractions were prepared and analyzed by western blotting using antibodies specific for (A) Ndi1, (B) Sdh1 and Sdh2, (C) Cor2 and Cyt1, (D) Cox2 and Cox4, and (E) F1α and F1β. Three independent segregant strains of flx1Δ and flx1Δ hem25Δ were used. The figure shown is representative of three independent analyses. Pixel intensity was measured and calculated by using Odyssey Software. Numbers under the lanes represent the mean of protein abundance normalized by the loading control Por1 and then to WT. The mean and the SEM were calculated from three independent western blot analyses. The significance of the differences on protein levels observed between the strains was calculated using ANOVA test with randomized factors (Table S3 in File S1). The deduced protein molecular weight (MW) of the bands revealed by western blotting was consistent with their MW: Ndi1 (57 kDa); Sdh1 (69 kDa) and Sdh2 (30 kDa); Cor2 (40 kDa) and Cyt1 (34 kDa); Cox2 (28 kDa) and Cox4 (17 kDa); F1α (58 kDa) and F1β (55 kDa).

