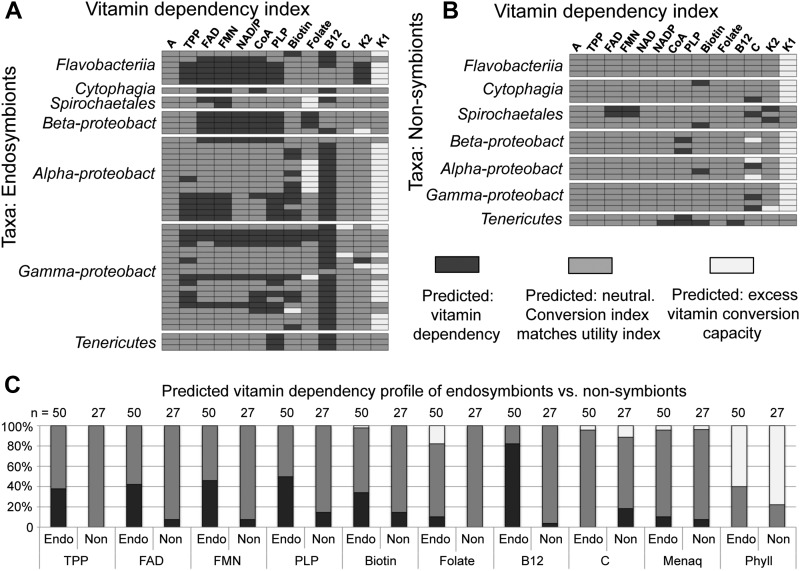
Figure 5.
Predicted vitamin dependency index of endosymbionts and related nonsymbionts. The images show case-by-case interpretations from comparison of the vitamin conversion index to the vitamin utility index. Light gray: cases where last-step conversion of an intermediate into an active vitamin form was predicted, but no utility for the product was apparent. Medium gray: cases where capacity was predicted for both vitamin conversion and vitamin utility by the organism. Dark gray: cases where no capacity for vitamin conversion was detected, though utility of the active vitamin product was predicted. Comparisons of the predicted vitamin utility index against the predicted vitamin conversion index are displayed for (A) endosymbionts and (B) non-symbiont taxonomic relatives of the endosymbionts. (C) The predicted dependency profiles for endosymbionts versus non-symbionts are also displayed with respect to each active vitamin form.

