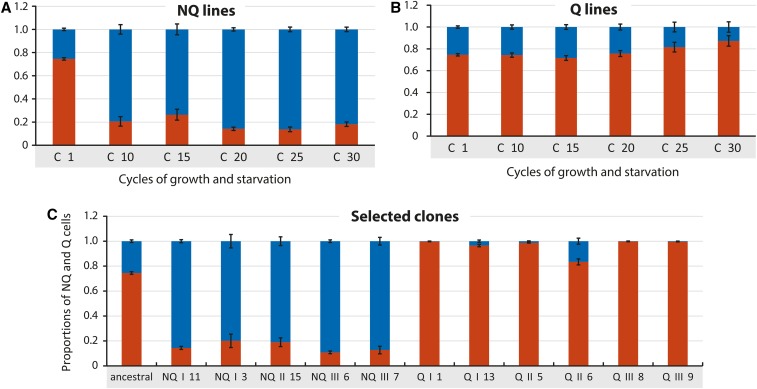
Figure 2.
Average proportions of the quiescent (Q) cells (red bars) and nonquiescent (NQ) cells (blue bars) in the populations at the selected experimental cycles of growth and starvation in: (A) NQ lines (average of I–III) where only NQ cells were selected for following cycles of growth and starvation, and (B) Q lines (average I–III) where only Q cells were selected for the following cycle. (C) Average proportions of the quiescent (Q) cells (red bars) and nonquiescent (NQ) cells (blue bars) after one cycle of growth and starvation in the populations derived from the clones isolated after 30 cycles, at the end of the experiment, and in the ancestral strain (Figure 1B).

