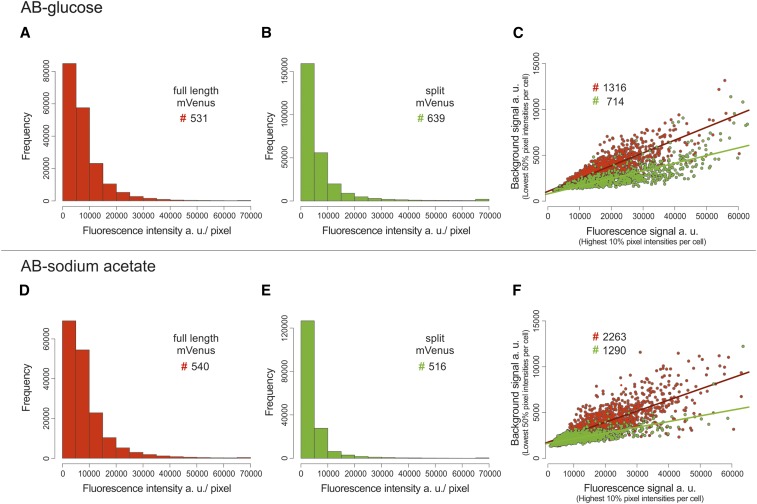
Figure 5.
Improved signal to background with split mVenus compared to full-length mVenus. Cells with OL1/UAS hybrid FROS array and λcI fused to full-length mVenus (highlighted in red, strain SM77) or BiFC constructs λcI fused to the N-terminal fragment of mVenus and Gal4 fused to the C-terminal fragment of mVenus (highlighted in green, strain SM65) were analyzed under fast growth (top panel, AB-glucose) or slow growth conditions (bottom panel, AB-sodium acetate). (A, B, D, and E) Frequency distribution of pixel fluorescence intensities from several hundred cells as indicated by #. Only cells with intensities below 65,000 and >fivefold signal to background ratio were analyzed [mean of 10% pixels with highest (signal)/ mean of 50% pixels with lowest intensity (background)]. (C and F) Scatter plots of mean fluorescence intensity of the highest 10% pixels vs. mean fluorescence intensity of the lowest 50% pixels within individual cells. Values above 65,000 on x-axis and above 15,000 on y-axis were excluded. Exposure times in AB-glucose were 50 msec for full-length mVenus and 200 msec for split mVenus and for AB-sodium acetate 50 msec for full-length mVenus and 600 msec for split mVenus. Quantification of fluorescence signals was done by MicrobeJ and data analyses by R with custom R scripts.

