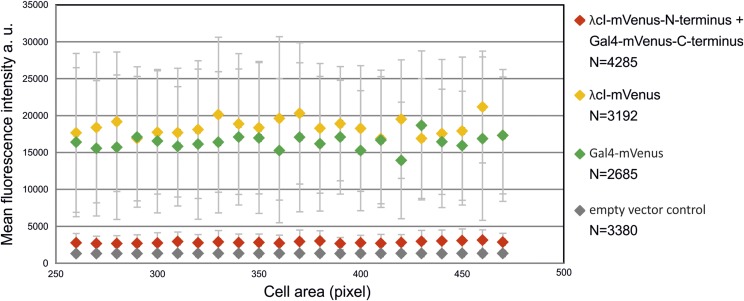
Figure 4.
Low background fluorescence in cells with BiFC constructs without hybrid FROS array. Mean fluorescence intensities of binned cells vs. cell area were plotted as indicated. Strain SM57 (red) contained λcI fused to the N-terminal fragment of mVenus and Gal4 fused to the C-terminal fragment of mVenus, strain SM69 (yellow) contained λcI fused to full-length mVenus, strain SM70 (green) contained Gal4 fused to full-length mVenus, and strain SM126 (gray) contained the empty vector. Fluorescence microscopy was performed with cells grown exponentially in AB-glucose. Exposure time was set to 100 msec. Number of recorded cells is indicated (N). Quantification of fluorescence signals was done by MicrobeJ and data analyses by R. Cells were grouped according to their cell area with moving windows of 10 pixels. Groups with <10 cells were excluded. Average values of two independent experiments are shown.

