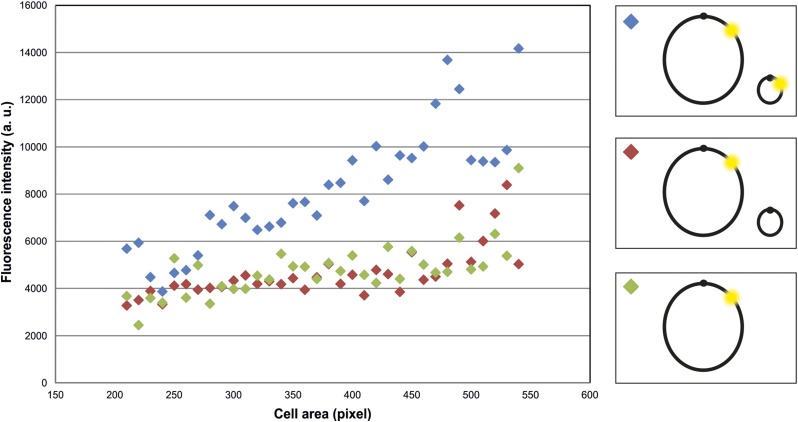
Figure 6.
Fluorescence signals of cells with one or two copies of the hybrid FROS array. Mean fluorescence intensities of cells were binned and plotted vs. cell area. E. coli strains used all have a copy of the OL1/UAS hybrid FROS array on the primary chromosome as depicted in the scheme (left panel). Strain SM153 (blue) carries replicon pMA301 with an additional copy of the OL1/UAS hybrid FROS array while the additional replicon (pMA310) in strain SM158 (red) presents the respective empty-vector control. Strain SM65 (green) contains only the BiFCROS array without additional replicon. All strains contain BiFC constructs of λcI fused to the N-terminal fragment of mVenus and Gal4 fused to the C-terminal fragment of mVenus. Fluorescence microscopy was performed with cells grown in AB-sodium acetate medium. Exposure time was set to 600 msec. Approximately 1000 cells per strain were recorded. Quantification of fluorescence signals was done by MicrobeJ and data analyses by R. Mean intensity of cells of strain SM57 that contains BiFC constructs with split mVenus without OL1/UAS hybrid FROS array was determined as background signal and subtracted from cell intensities of strains shown here. Cells were grouped according to their cell area in bins of 10 pixels. Groups with <10 cells were excluded. Average values of three independent experiments are shown. SD was not plotted for clarity reasons.

