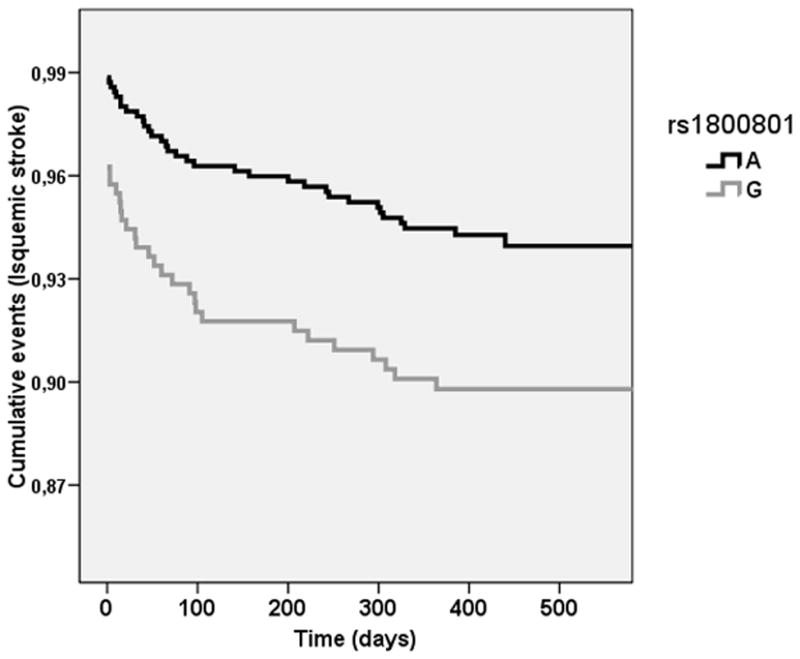
Figure 1. Kaplan-Meier curves of rs1800801 and time of recurrent ischemic stroke event.

X axis: time (days) from first stroke or TIA to recurrent ischemic stroke, p value = 9 × 10⁻³. Y axis: cumulative events (ischemic strokes). Data obtained from Discovery cohort A, N = 1,494.
