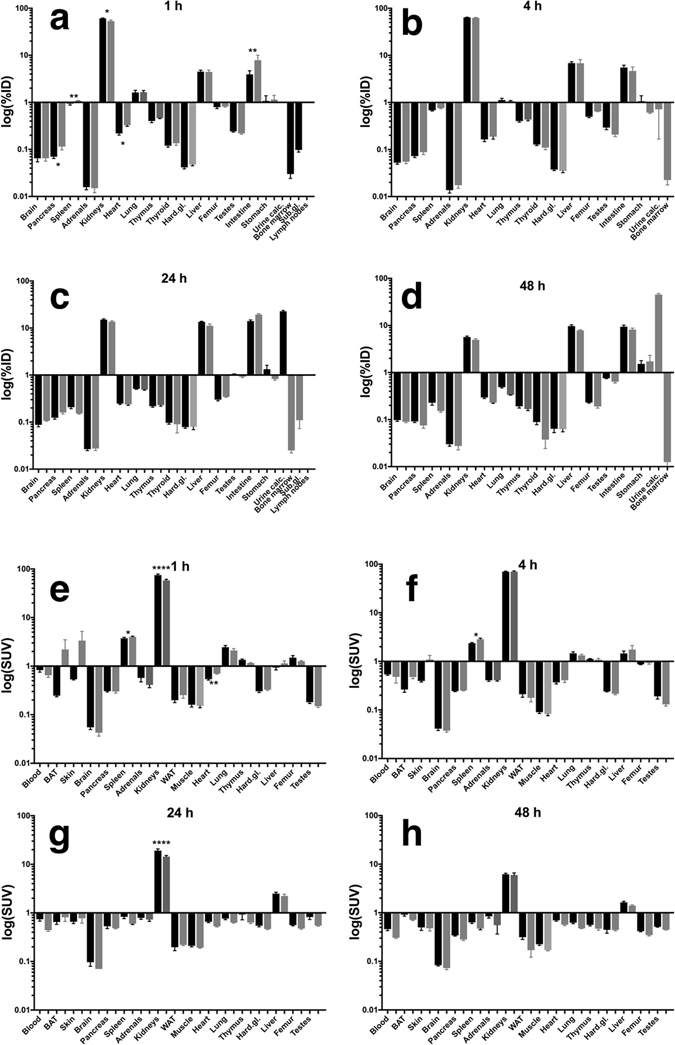
Figure 2.

Biodistribution of the [64Cu]Cu-NOTA-HsTX1[R14A] in rats after single injection (i.v., black bars, n = 12; s.c., gray bars, n = 4). The data are presented as %ID (a–d) or SUV (e–h) in means ± SEM; BAT – brown adipose tissue, WAT – white adipose tissue, Hard. Gl. – Harderian glands, Sub. gl. – submandibular glands, lymph nodes – submandibular lymph nodes, urine calc. – urine calculated as difference between injected dose and recovery.
