Figure 6.

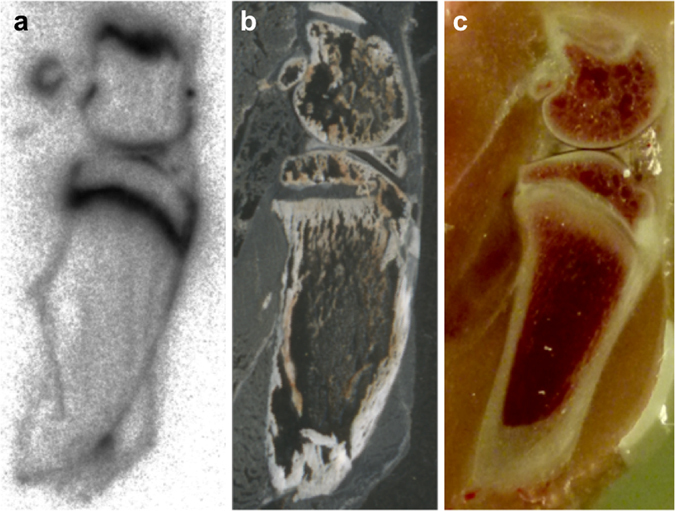
Distribution in the bone. Representative (a) radioluminogram, (b) histological frozen section (20 µm), and (c) photography from 4 independent studies of rat femur surface 4 h after single intravenous injection of [64Cu]Cu-NOTA-HsTX1[R14A].

Distribution in the bone. Representative (a) radioluminogram, (b) histological frozen section (20 µm), and (c) photography from 4 independent studies of rat femur surface 4 h after single intravenous injection of [64Cu]Cu-NOTA-HsTX1[R14A].