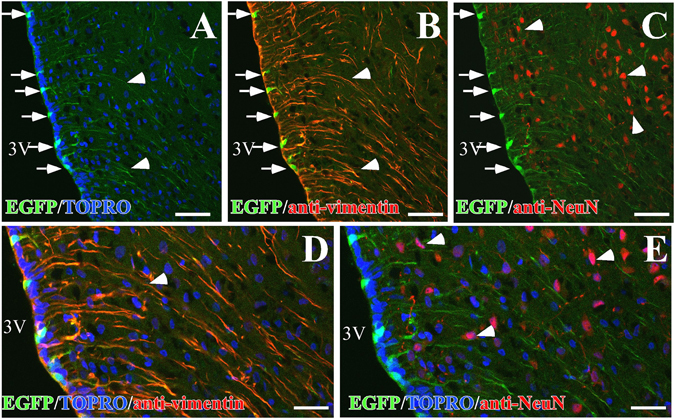
Figure 3.

Co-distribution of EGFP and the neuronal marker, NeuN, in the basal hypothalamus. (A–E) Representative confocal images of one focal plane using anti-vimentin (red) or anti-NeuN (red) antibodies as well as EGFP fluorescence (green) and TOPRO-3 (blue). (A) Image showing EGFP in an α-/β-tanycyte transition region. (B) EGFP detected in the proximal (arrows) and distal processes (arrowheads) of vimentin-positive α-and β-tanycytes. (C) The neuronal marker, NeuN, distribution (red), showing the absence of colocalization with EGFP. (D,E) High magnification image of the area shown in (B and C). Scale bars (A–C) 50 μm; (D,E) 25 μm.
