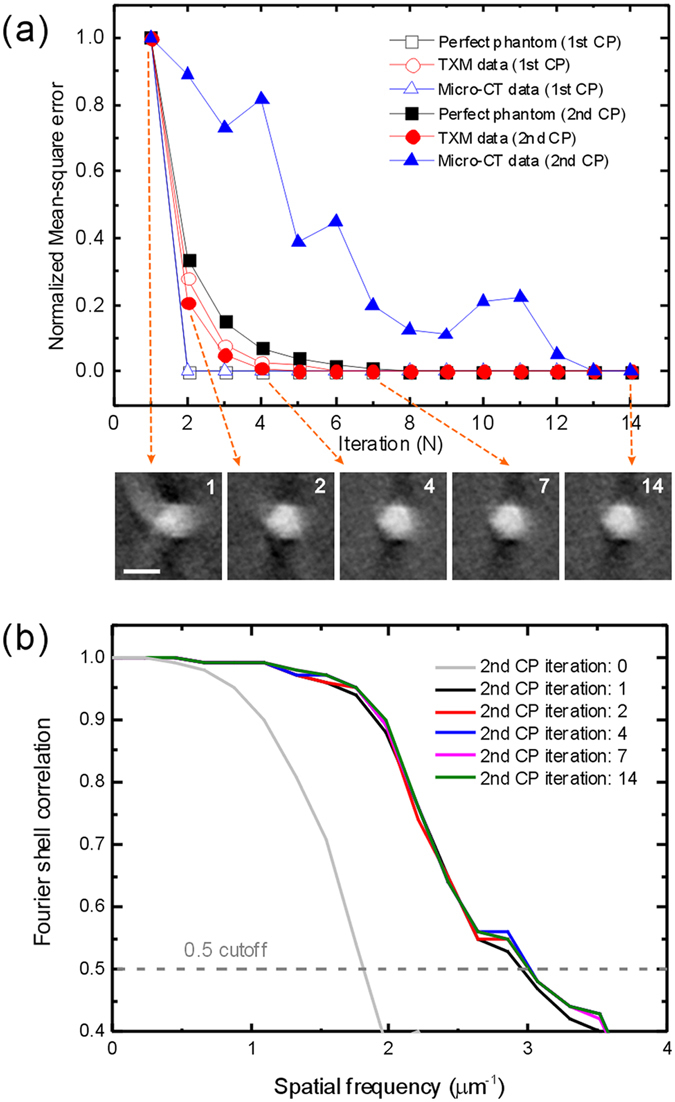
Figure 8.

Convergence of Faproma algorithm. (a) Comparison of the normalized mean-square error and iteration times among various 3D tomography datasets. The inserted images show the resulted reconstruction quality with different registration iteration times using Faproma second correction process (see Supplementary Movie S5). (b) Three-dimensional Fourier shell correlation among different iteration times by the second correction process of Faproma. CP: correction process. Scale bar is 1 μm.
