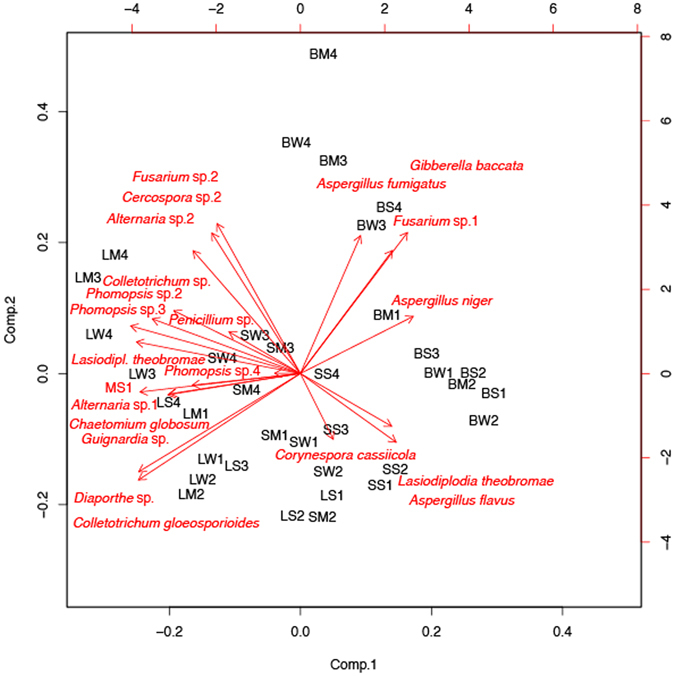
Figure 3.

Biplot (Principal components analysis) depicting the relationship between fungal endophyte taxa (arrows) and sampling units (tissue type, season and location). The longer the arrow the more influence has the fungus connected with it, and the further removed a sampling unit gets positioned from the centre the stronger its influence. The closer a sampling unit and a fungal taxon the stronger is their relationship. The first letter of the three-letter acronyms denotes the tissue type (B, barks; L, leaf; S, stem), the second the season (W, winter; S, summer; M, monsoon), and the third the location.
