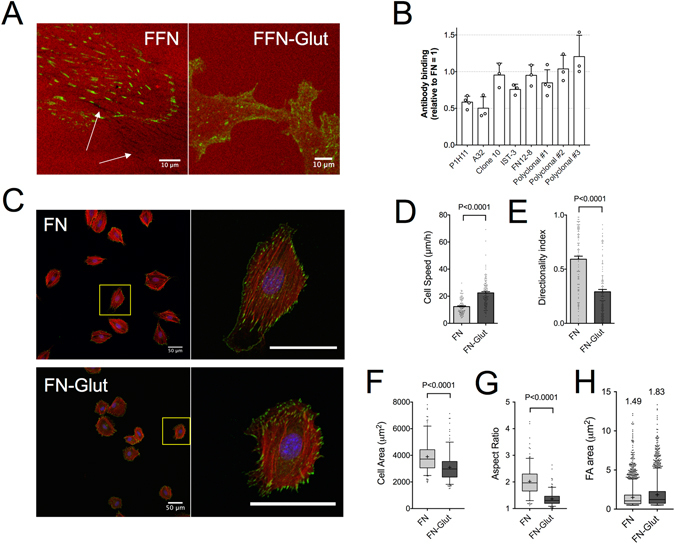
Figure 5.

FN cross-linking with glutaraldehyde hinders fibroblast polarization and reduces directional persistence in fibroblast migration. (A) Confocal microscopy images of REF, fixed 24 hours after seeding on control substrates coated with 10 μg/ml fluorescently-labeled FN (red; FFN) or treated with 1% glutaraldehyde (FFN-Glut). Cells were immunostained against tensin-1 (green). Arrows indicate streak-like patterns where FFN was removed (remodeled) from the substrate in the absence of glutaraldehyde cross-linking. (B) Quantification of antibody binding to FN-Glut using a modified ELISA assay showed reduced binding compared to FN-coated substrates of some monoclonal anti-FN antibodies (clones P1H11, A32 and IST-3), indicating altered FN conformation upon glutaraldehyde cross-linking. On the other hand, all tested polyclonal antibodies and some of the monoclonal antibodies (clones 10 and FN12-8) displayed similar binding efficiency to FN. Each point represents an independent experiment with n = 2–5. Mean ± s.d. are presented. (C) Confocal microscopy images of REF on FN-Glut or FN-coated substrates, fixed 6 hours after seeding and stained against F-actin (red), pY to indicate cell-substrate adhesions (green) and DNA to image the nucleus (blue). Images on the right are zoomed views of the highlighted yellow boxes. Scale bars 50 μm. (D) REF speed increased on FN-Glut, while (E) directionality index was markedly reduced compared to FN-coated substrates (Nexp = 3; n = 60). Mean ± s.e.m. are presented in (D,E). (F) REF projected area and (G) aspect ratio were lower on FN-Glut substrates (>200 cells analyzed; Nexp = 2). (H) FA area increased on FN-Glut compared to FN-coated substrates (mean values indicated on graph; >2500 FAs analyzed; Nexp = 2). The middle line in box plots indicates the median, the box indicates the interquartile range, the whiskers the 5th and 95th percentiles and the cross the mean. Values were compared using an unpaired t-test with Welch’s correction.
