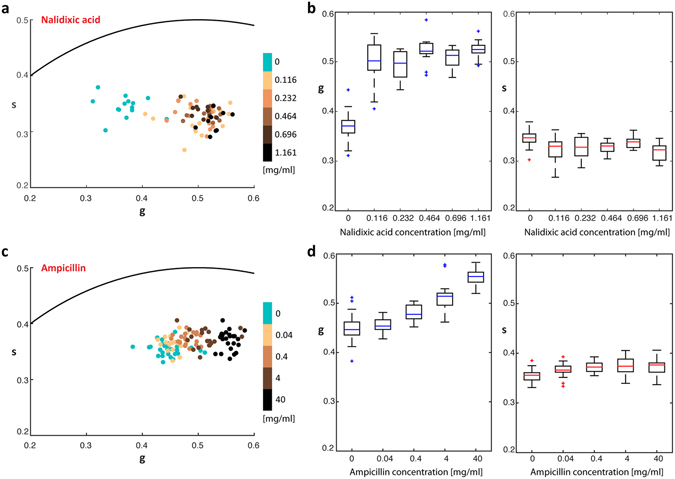
Figure 2.

Bacterial phasor response to bacteriostatic and bactericidal antibiotic treatment. (a) Bacterial phasor of E. coli control culture (cyan) and culture treated with increasing concentrations of a bacteriostatic antibiotic, nalidixic acid (light to dark brown). (b) Distribution of g and s within populations of cells at each concentration of nalidixic acid. (c) Bacterial phasor of E. coli control culture (cyan) and culture treated with increasing concentrations of bactericidal antibiotic, ampicillin (light to dark brown). (d) Distribution of g and s within populations of cells at each concentration of ampicillin.
