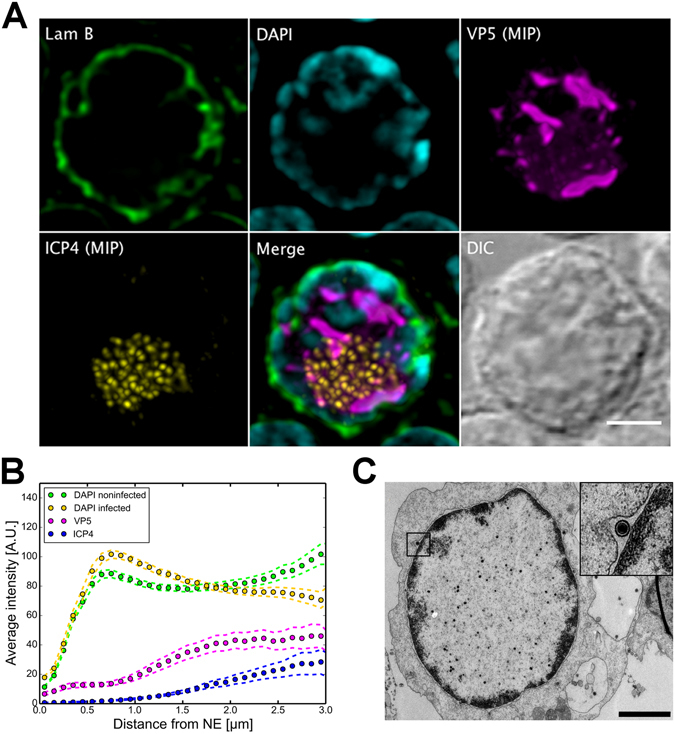
Figure 1.

Nuclear distribution of host chromatin in infected cells with enlarged VRCs. (A) Confocal microscopy images showing the distribution of DAPI-labelled chromatin (cyan) and lamin B (green) together with maximum intensity projections (MIP) of viral EYFP-ICP4 (yellow) and VP5 (magenta) proteins at 24 h p.i. A differential interference contrast (DIC) image is also shown. Scale bar, 3 µm. (B) The mean spatial distribution of chromatin in infected (n = 16) and non-infected (n = 20) cells together with VP5 and ICP4 shown as plots of the intensity at increasing distances from the NE. Dotted error lines represent the mean ± the standard error of the mean (SEM). (C) A TEM image of an infected cell nucleus at 24 h p.i. The inset shows an enlarged view of the boxed area containing the viral capsid in the space between the inner and outer leaflets of the nuclear membrane. Scale bar, 3 µm.
