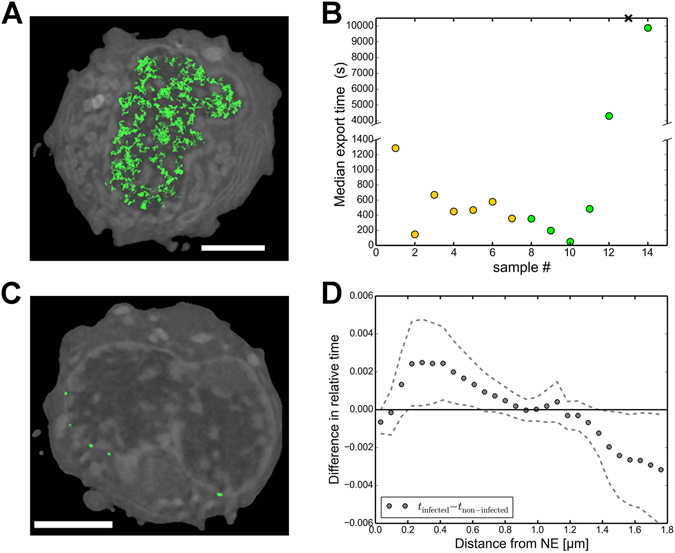
Figure 5.

Nuclear transport of capsids to the NE. (A) Paths traced by 1000 capsids for 5 seconds (green) near one plane of the simulation geometry. The displayed path has a lower intensity when it is farther away from the SXT orthoslice shown as background (grey). Low and high LAC values of chromatin are indicated with dark and light greyscale values. Scale bar, 3 μm. See also Supplementary Movie S2. (B) Median transport times of capsids to the NE for infected (yellow) and non-infected (green) cells. The control cell with a cross symbol did not allow passage of capsids, and the median time is therefore not defined for it. The break in the y-axis separates low and high transport times. (C) Low-density nuclear egress sites of capsids (green) in an SXT cross-section of an infected cell. Scale bar, 3 μm. See also Supplementary Movie S3. (D) Difference in the relative amount of time spent by capsids at various distances from the NE between the infected and non-infected cells. Dotted error lines represent the mean ± SEM.
