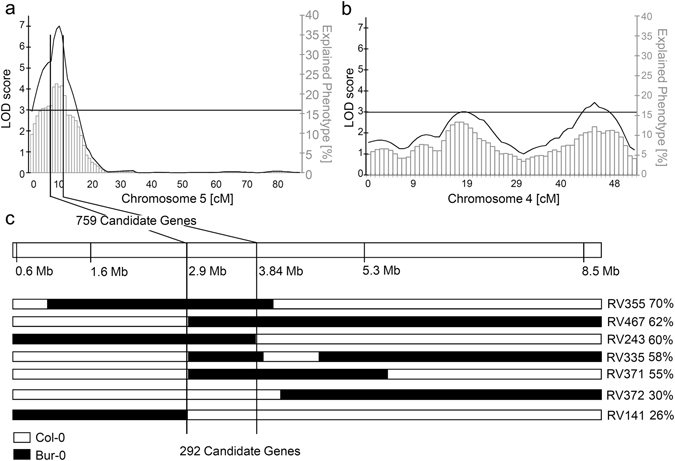
Figure 6.

Genetic linkage mapping of loci contributing to variation in Cd tolerance across the Bur-0 × Col-0 RIL population. QTL mapping with MapQTL5 after determination of the relative root growth of 131 RILs at 2 µM CdCl2 detected a major QTL on chromosome 5 (a) and two minor QTLs on chromosome 4 (b). (c) Through additional marker analysis the QTL on chromosome 5 was narrowed to an interval located between 2.9 and 4.01 Mb. Indicated are the genotypes (white: Col-0; black Bur-0) and the Cd tolerance (in %RRG) for informative RILs.
