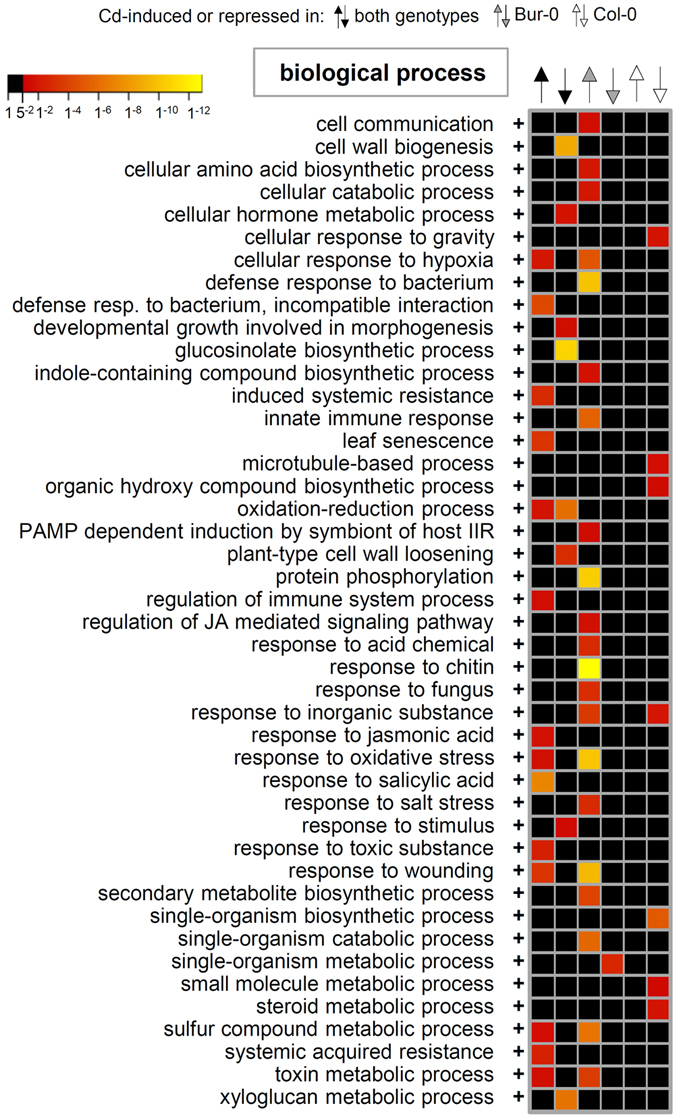
Figure 7.

GO terms overrepresented in common or accession-specific Cd responses. Genes with a ≥2fold response (P adj < 0.05) to Cd treatment in both accessions (black arrows for induction or repression under Cd exposure) or in only one accession (Col-0: white arrows; Bur-0: grey arrows) were selected for GO term enrichment analysis. Depicted are P adj. values (Bonferroni correction) for the most defined biological processes over-represented in at least one category; no under-representations were found (complete results of the Panther analysis can be found in Supplementary dataset S2).
