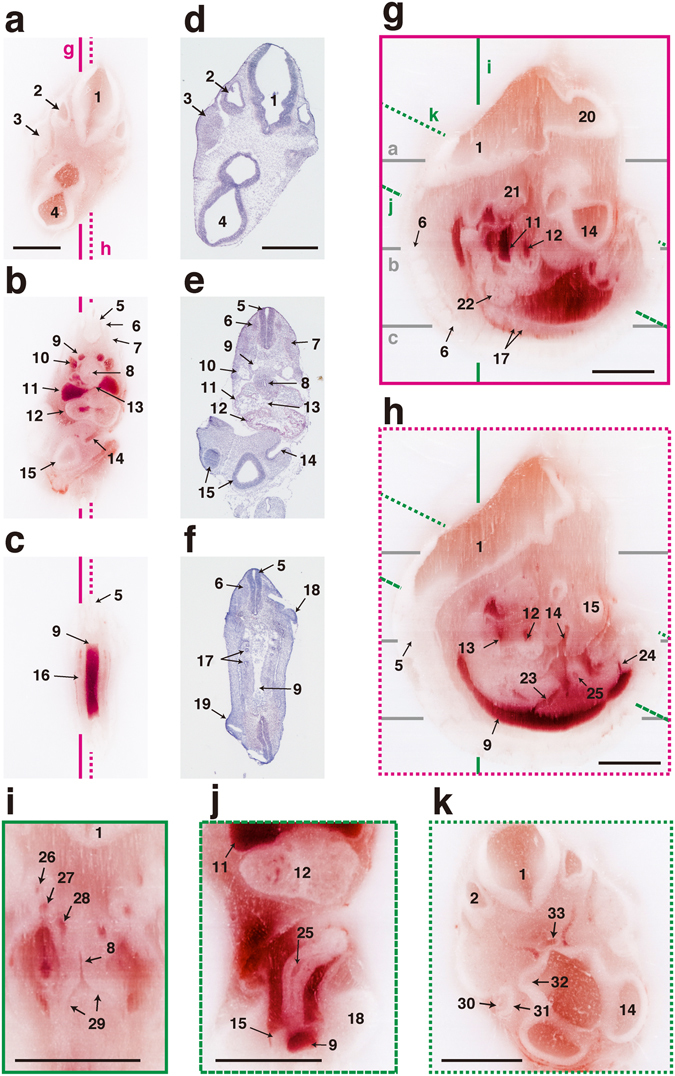
Figure 2.

Correlation between 2D images and MPR images of E10.5 mouse embryo. A mouse embryo was imaged by the CoMBI system and shown as MPR images. (a–c) Block-face images. (a–c) Frozen sections were collected at the positions of (a–c). (g,h) The sagittal planes were made by MPR from 565 block-face images. The nervous, cardiovascular, and urogenital systems are shown. (i) Reconstructed coronal planes of the thorax show the respiratory system and vascular system. (j) Reconstructed plane of the abdomen shows gastrointestinal tract. (k) Reconstructed plane of the head shows sensory organs. 1: myelencephalon, 2: otic vesicle, 3: trigeminal ganglion, 4: diencephalon, 5: neural tube, 6: spinal ganglion, 7: somite, 8: trachea, 9: dorsal aorta, 10: anterior cardinal vein, 11: atrium, 12: ventricle, 13: foramen ovale, 14: olfactory pit, 15: telencephalon, 16: urogenital ridge, 17: mesonephron, 18: forelimb bud, 19: hindlimb bud, 20: mesencephalon, 21: mandible, 22: liver, 23: superior mesenteric artery, 24: umbilical artery, 25: intestine, 26: 3rd aortic arch, 27: 4th aortic arch, 28: 6th aortic arch, 29: bronchus, 30: lens, 31: retina, 32: optic stalk, 33: Rathke’s pocket. Bars: 1 mm. Note that labels 5, 6, 9, 11–14, and 17 indicate structures on lines b and c for correlation between H & E stained sections (e,f) and MPR images (g,h).
