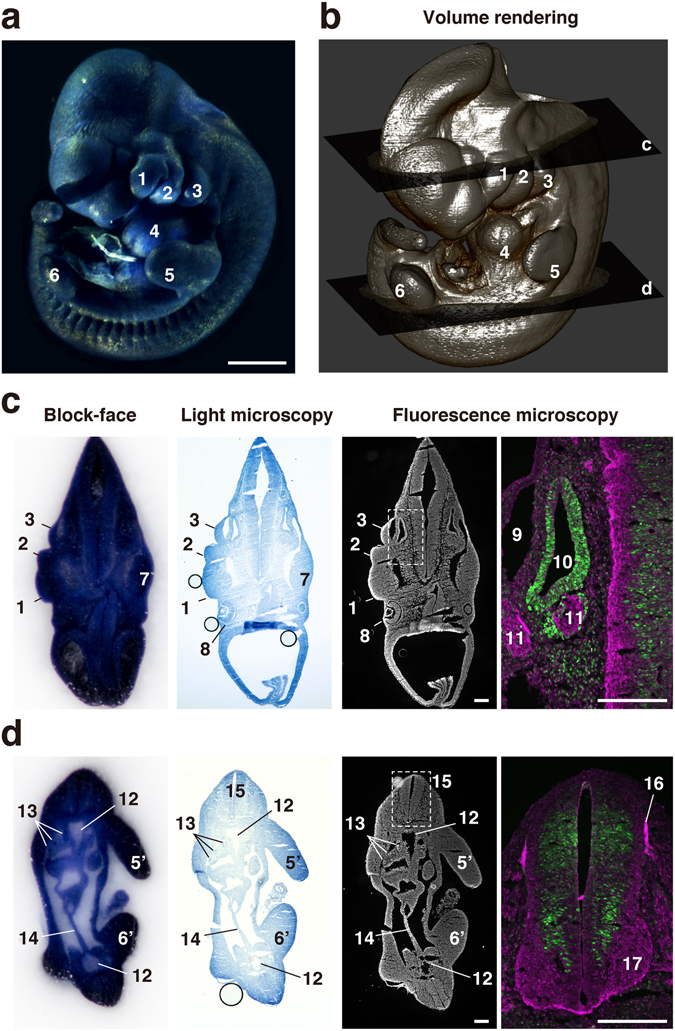
Figure 3.

Correlation between 2D images and volume rendering image of E10.5 mouse embryo. (a) An E10.5 mouse embryo was prestained with hematoxylin and examined using the CoMBI technique. (b) Volume rendering image was reconstructed from 503 block-face images to show the surface structures of the mouse embryo. (c,d) At the planes c and d in (b), frozen sections were collected and fluorescently labeled for nuclei, cyclin D1, and VAMP2. The block-face images are shown in the rightmost column. The sections were examined by light microscopy, and showed nuclei prestained with hematoxylin. The sections were also examined by fluorescence microscopy, and showed nuclei labeled with DAPI. Distributions of VAMP2 (a marker of synaptic vesicles, green) and cyclin D1 (cell cycle marker, magenta) are shown at higher magnification. 1: maxillary process, 2: mandibular arch, 3: hyoid arch, 4: heart, 5: left forelimb, 5′: right forelimb, 6: left hindlimb, 6′: right hindlimb, 7: trigeminal ganglion, 8: eye, 9: primary head vein, 10: otic vesicle, 11: facioacoustic ganglion complex, 12: dorsal aorta, 13: mesonephros, 14: mesentery, 15: neural tube, 16: dorsal root, 17: ventral horn. Bars in a: 1 mm, c, d: 200 µm.
