
Figure 2.
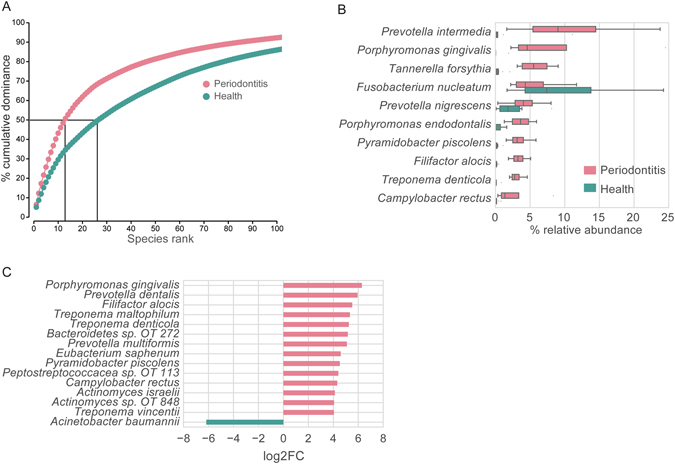
Taxonomic composition of transcripts in health and disease based on HOMD database. (A) Dominance plot showing the cumulative average contribution of individual genomes ranked according to transcript abundance of the total mapped reads. (B) The relative abundance of transcripts from the top 10 most abundant species in periodontitis in comparison with their abundance in health. (C) The differential activity of the microbial species based on the total mapped transcripts. The differential expression analysis was carried out by edgeR. Only species with FDR ≤ 0.05 and log2CPM ≥ 8 and absolute log2FC ≥ 4 are shown. If there were several strains for one species, those transcripts were pooled. Transcripts were mapped to the HOMD database. The bottom and top of the box show the first and third quartiles, the line inside the box indicates the median, and the ends of the whiskers represent the minimum and maximum, the dots on the outside of the whiskers represent outliers.