
Figure 3.
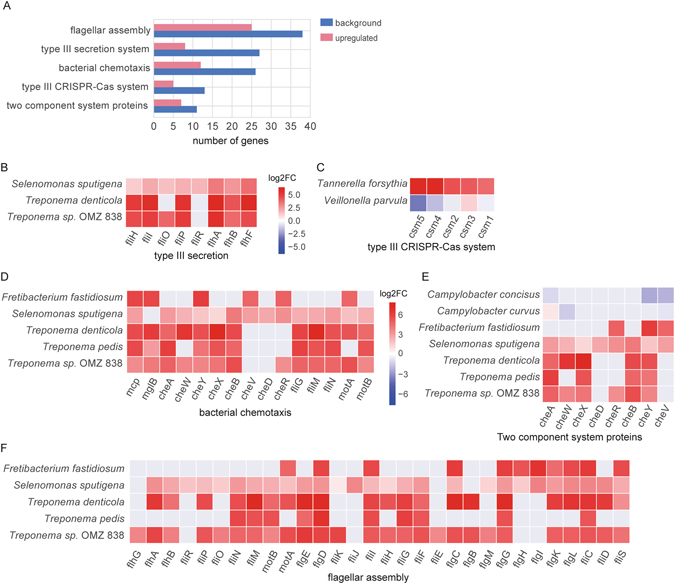
KEGG pathways and functional modules enriched in periodontitis and key microbial players driving the shifts. (A) Enrichment of the five most strongly up-regulated KEGG modules in periodontitis. The red bars indicate the number of up-regulated KEGG orthologous gene in the gene set, while dark blue bars show the number of total expressed genes of a given pathway or module. Only the enriched gene sets with FDR < 0.1 and (number of up-regulated genes)/(number of expressed) > 25% are shown here. The complete list of all enriched pathways and modules can be found in Table 1. (B–F). Key microbial players driving the up-regulation of those functional pathways. Pathways consist of several KO genes (Supplementary Table 3), each of which contains several species specific genes. Only species specific genes with expression level count per million reads (CPM) ≥ 10 are shown. The horizontal axis shows the KEGG orthology genes in the pathway and vertical axis shows the microorganisms in which these KO genes were up- or down-regulated. Note different scales for B,C and D–F.