
Figure 4.
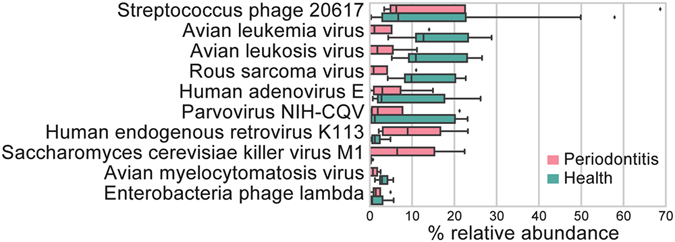
Virus transcripts in periodontal pockets. All virus genomes from NCBI database were used as mapping reference. Ten most abundant viruses are shown which accounted for about 80% of viral sequences. The bottom and top of the box show the first and third quartiles, the line inside the box indicates the median, and the ends of the whiskers represent the minimum and maximum, the dots on the outside of the whiskers represent outliers.